The Big Board
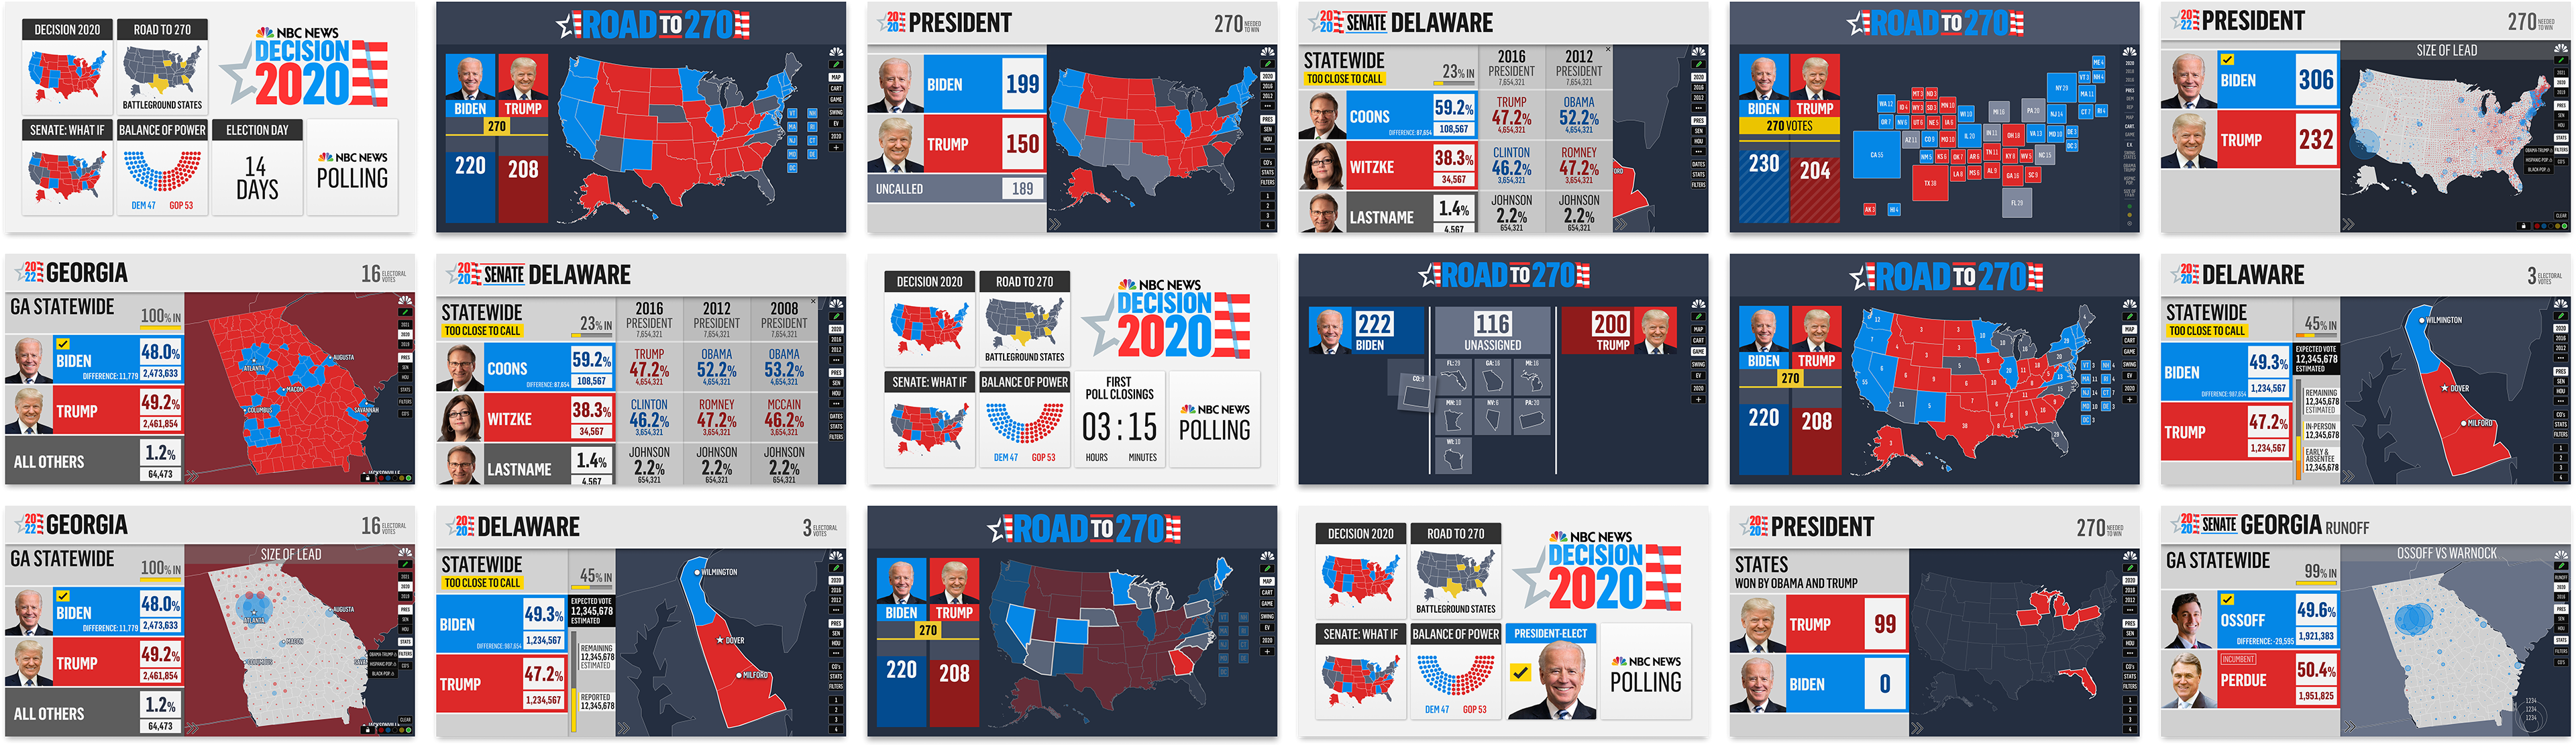
A sample of some mockups of the Big Board
Overview
The challenge: Election night viewers demand rapid, interpreted results. In the days leading up to the election, they seek insights into what to anticipate and the implications of various outcomes. Users need quick access to specific, granular results, along with tools to visualize potential election night scenarios.
The opportunity: This presented an opportunity to empower on-air talent to efficiently access and communicate election results in a viewer-friendly way, and to help them illustrate different potential election night outcomes.
My role
I was the sole designer for the Big Board from the 2020 primaries to the midterm elections in 2022, with guidance from my manager. Our cross-functional team consisted of a product manager, anywhere 7 developers, and a QE person.
How might we...
Empower on-air talent to quickly access specific election results and present them in a way that is easily understandable for viewers?
And how might we provide on-air talent with the tools to effectively tell different election scenarios to viewers?
My process
For all of Big Boards features, our access to on-air talent was limited. We conducted mainly contextual inquiries by watching the talents use the Big Board on-air and see if they were able to complete their tasks and track their movements and focus during on-air segments.
Our solution
Results Map: Developed a national map with navigation to states, counties, and districts.
Navigation: Enabled navigation to results for different years, offices, and locations.
Historical Drawer: Integrated navigation to different election years with historical data presentation.
A What If Map: Created a feature for building hypothetical maps to explore various scenarios.
A 3-Column Game: Developed an interactive tool where on-air talent can manipulate state tiles and assign electoral votes to different candidates.
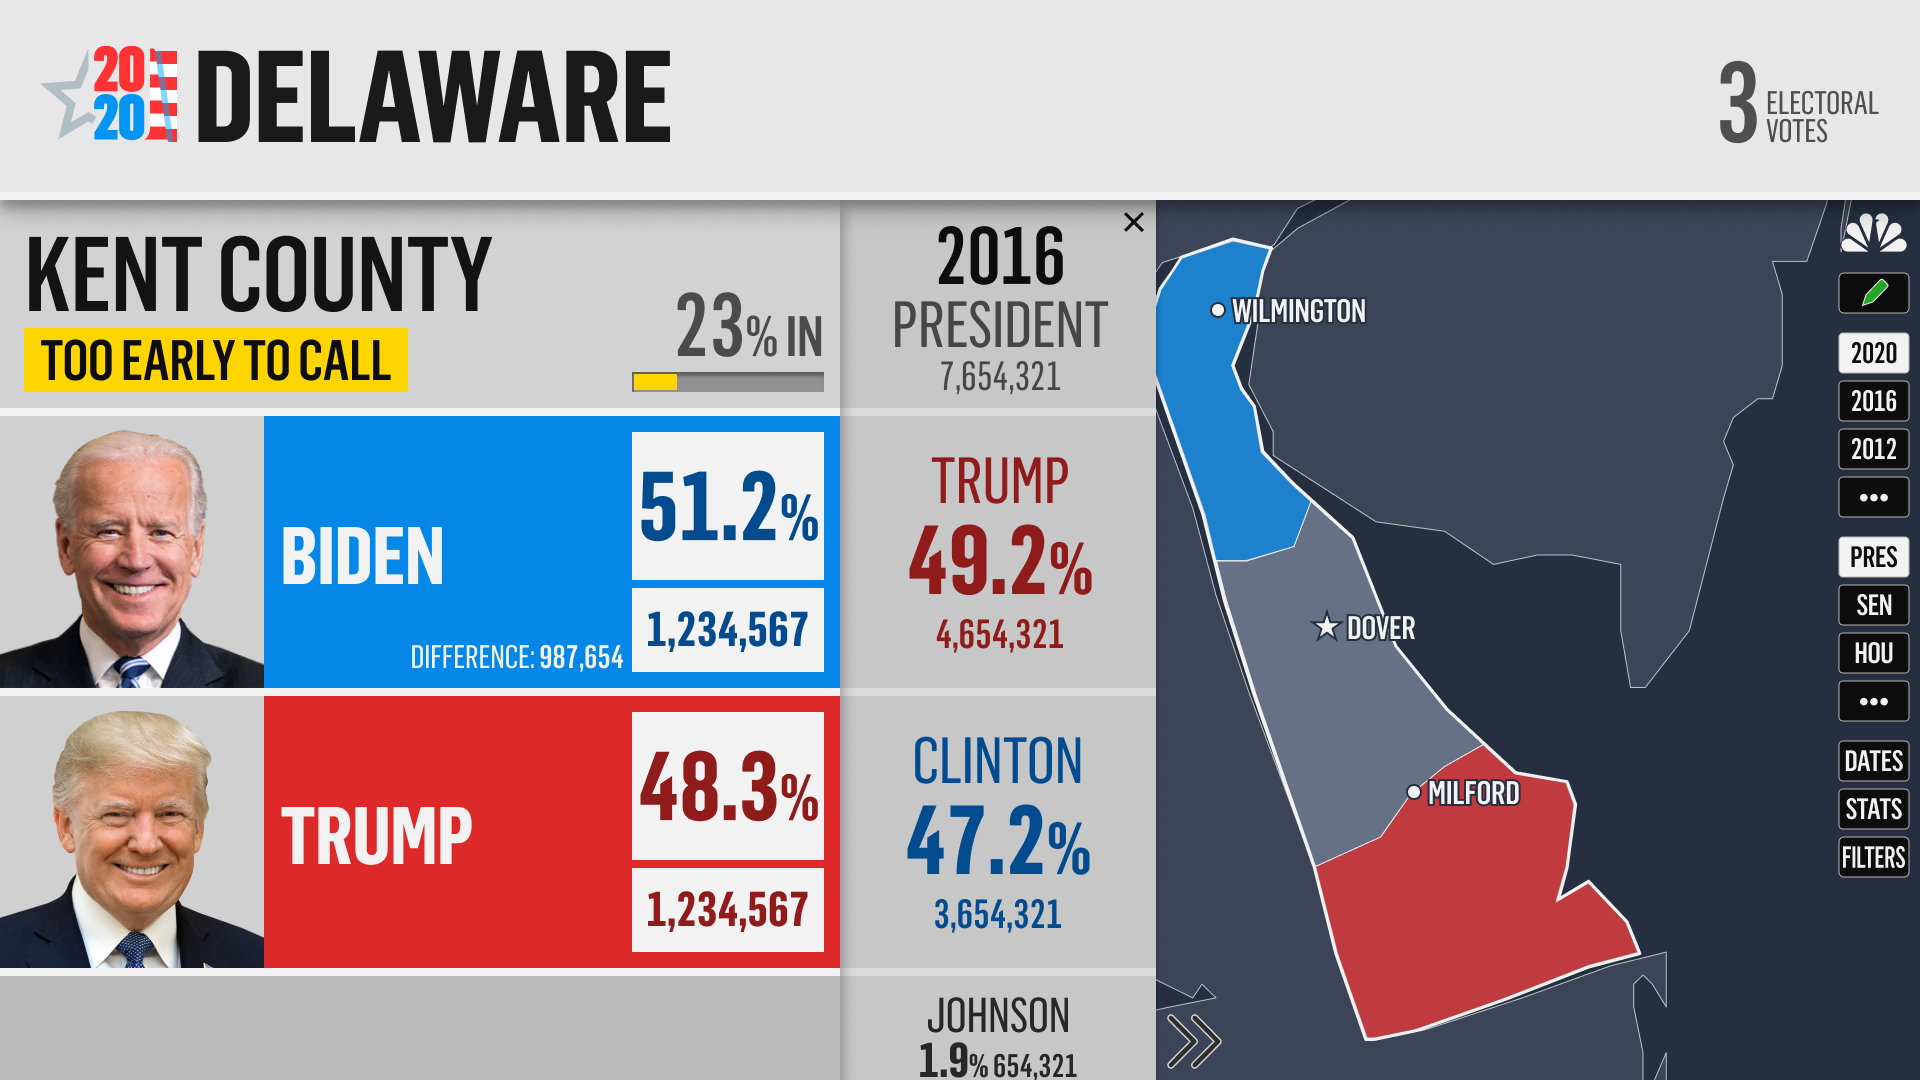
Results Map
This is the main feature of the Big Board. On election night, the on-air talent to use this map to navigate to different races, states, counties, and districts, and show the results in those regions as well as the historical data
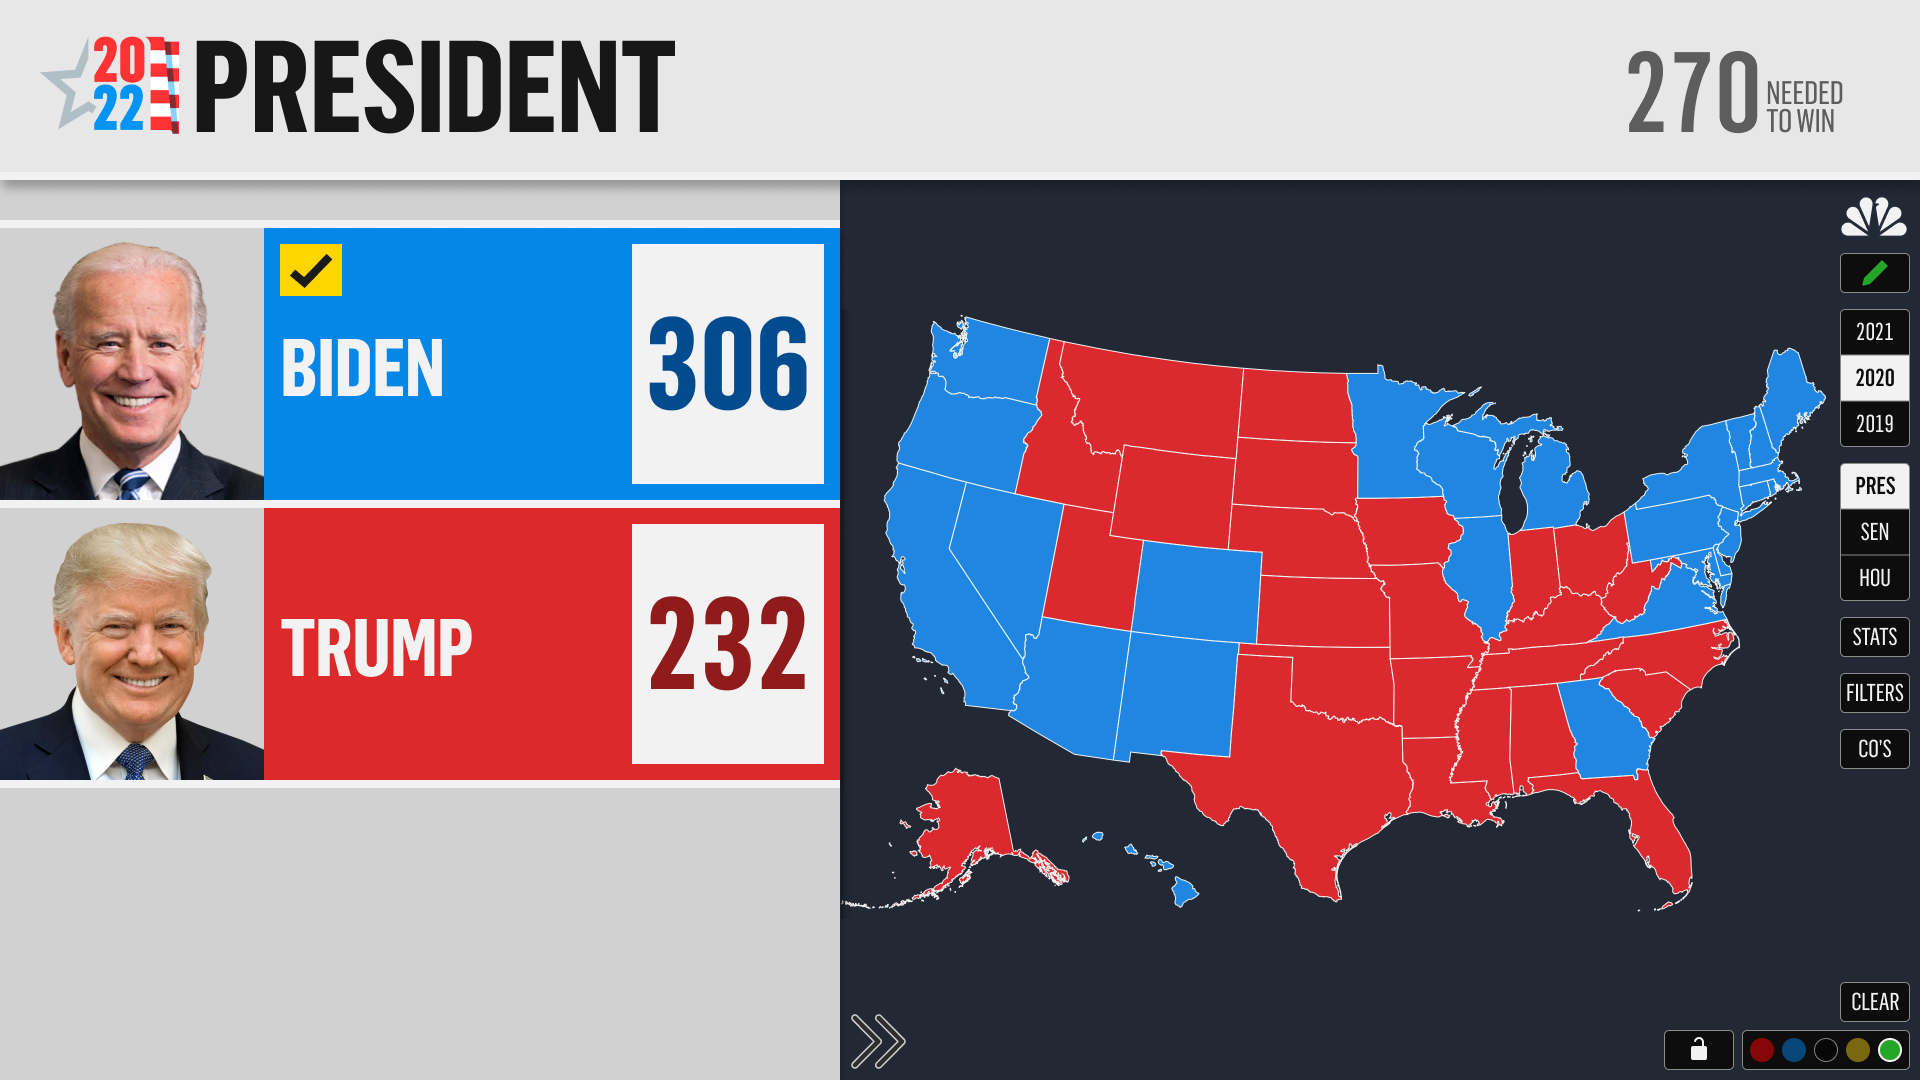
National map of the 2020 results
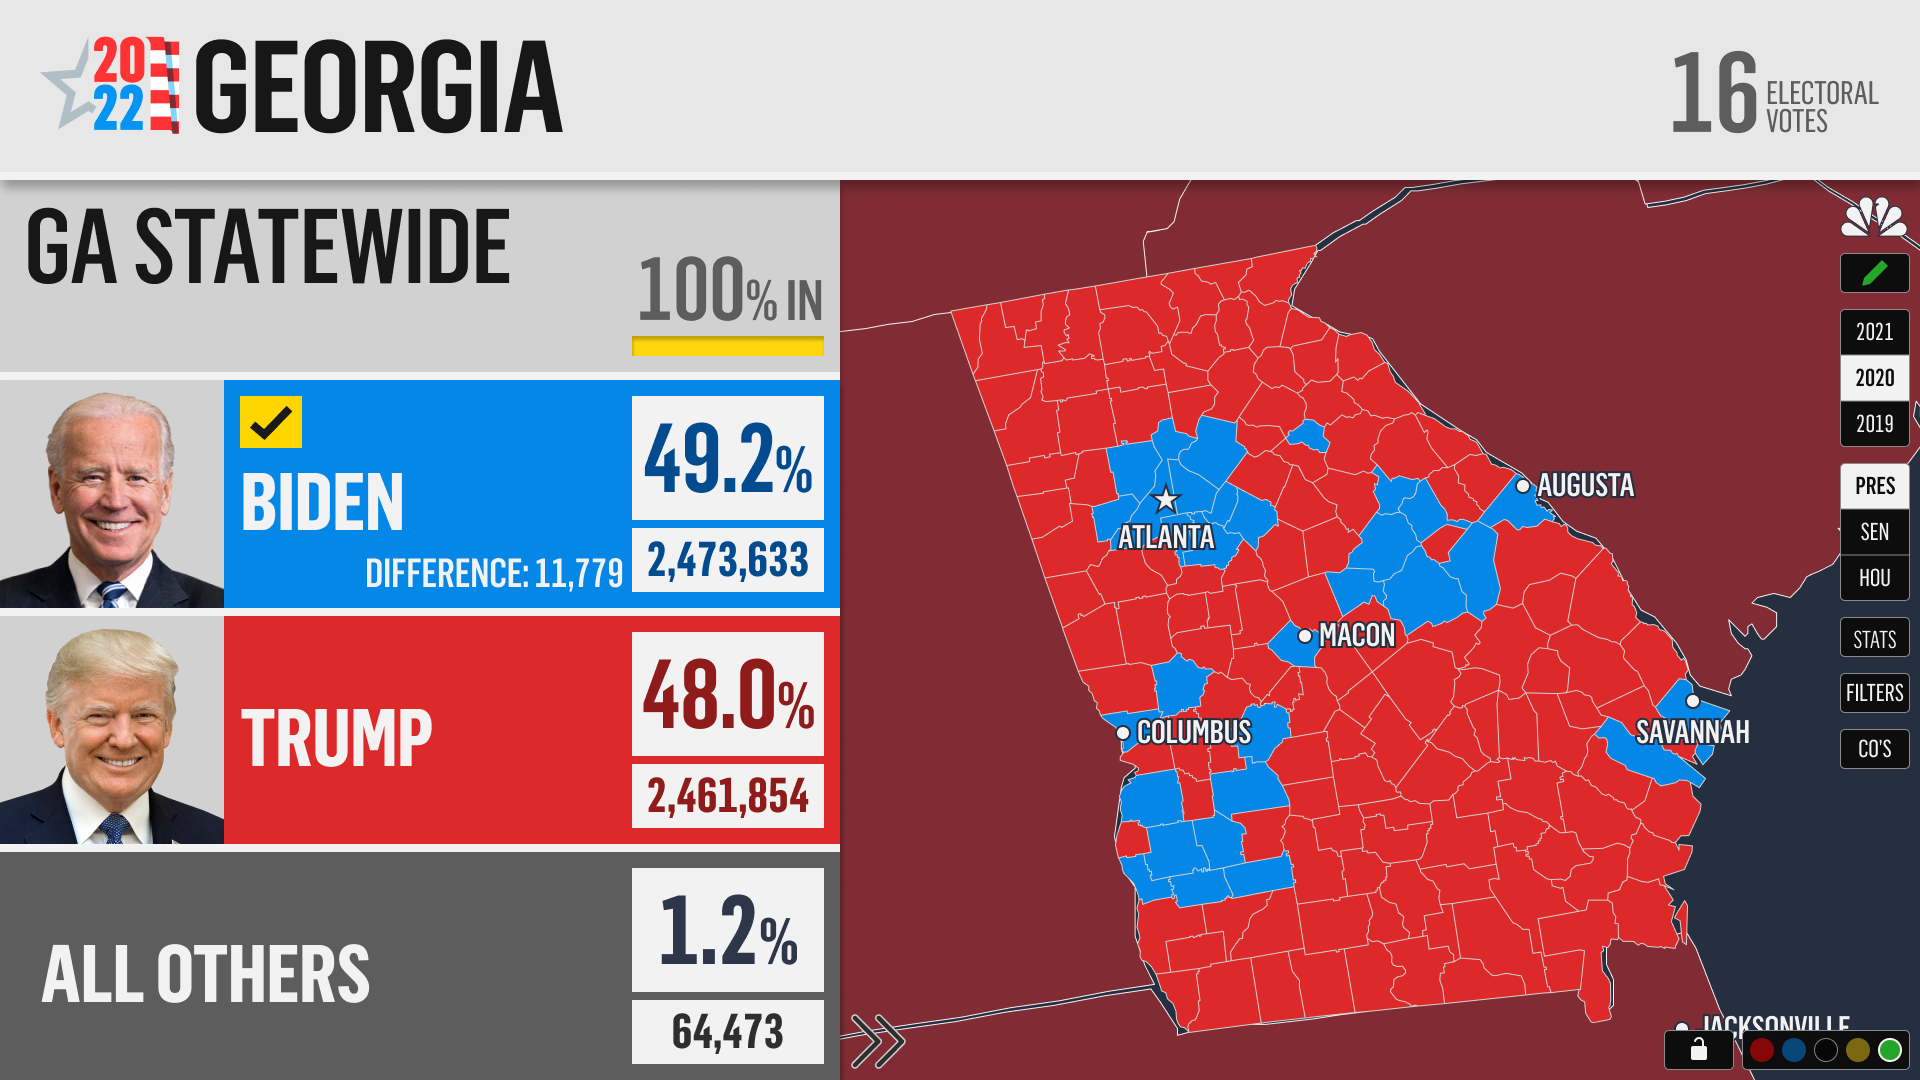
Georgia map of the 2020 results
Navigation
This was the main navigation that the on-air talent used to go to different election years, and different offices.
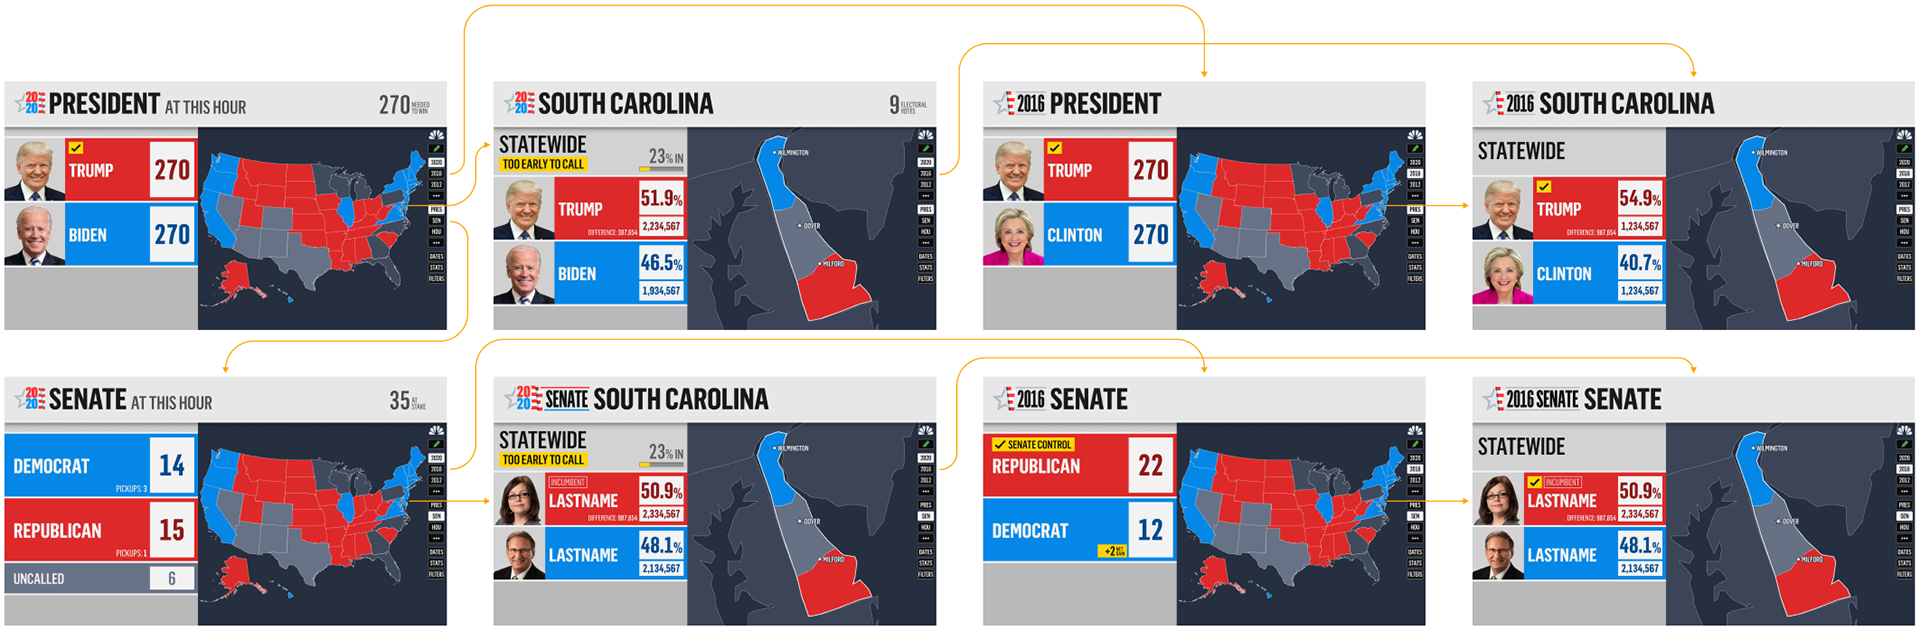
A small sample of the numerous ways the user can navigate to different races, years, and locations
Historial Drawer
This served as a method to efficiently showcase historical race data within the regional context and to juxtapose it with other election years.
A mockup of 1 historical vote drawer opened
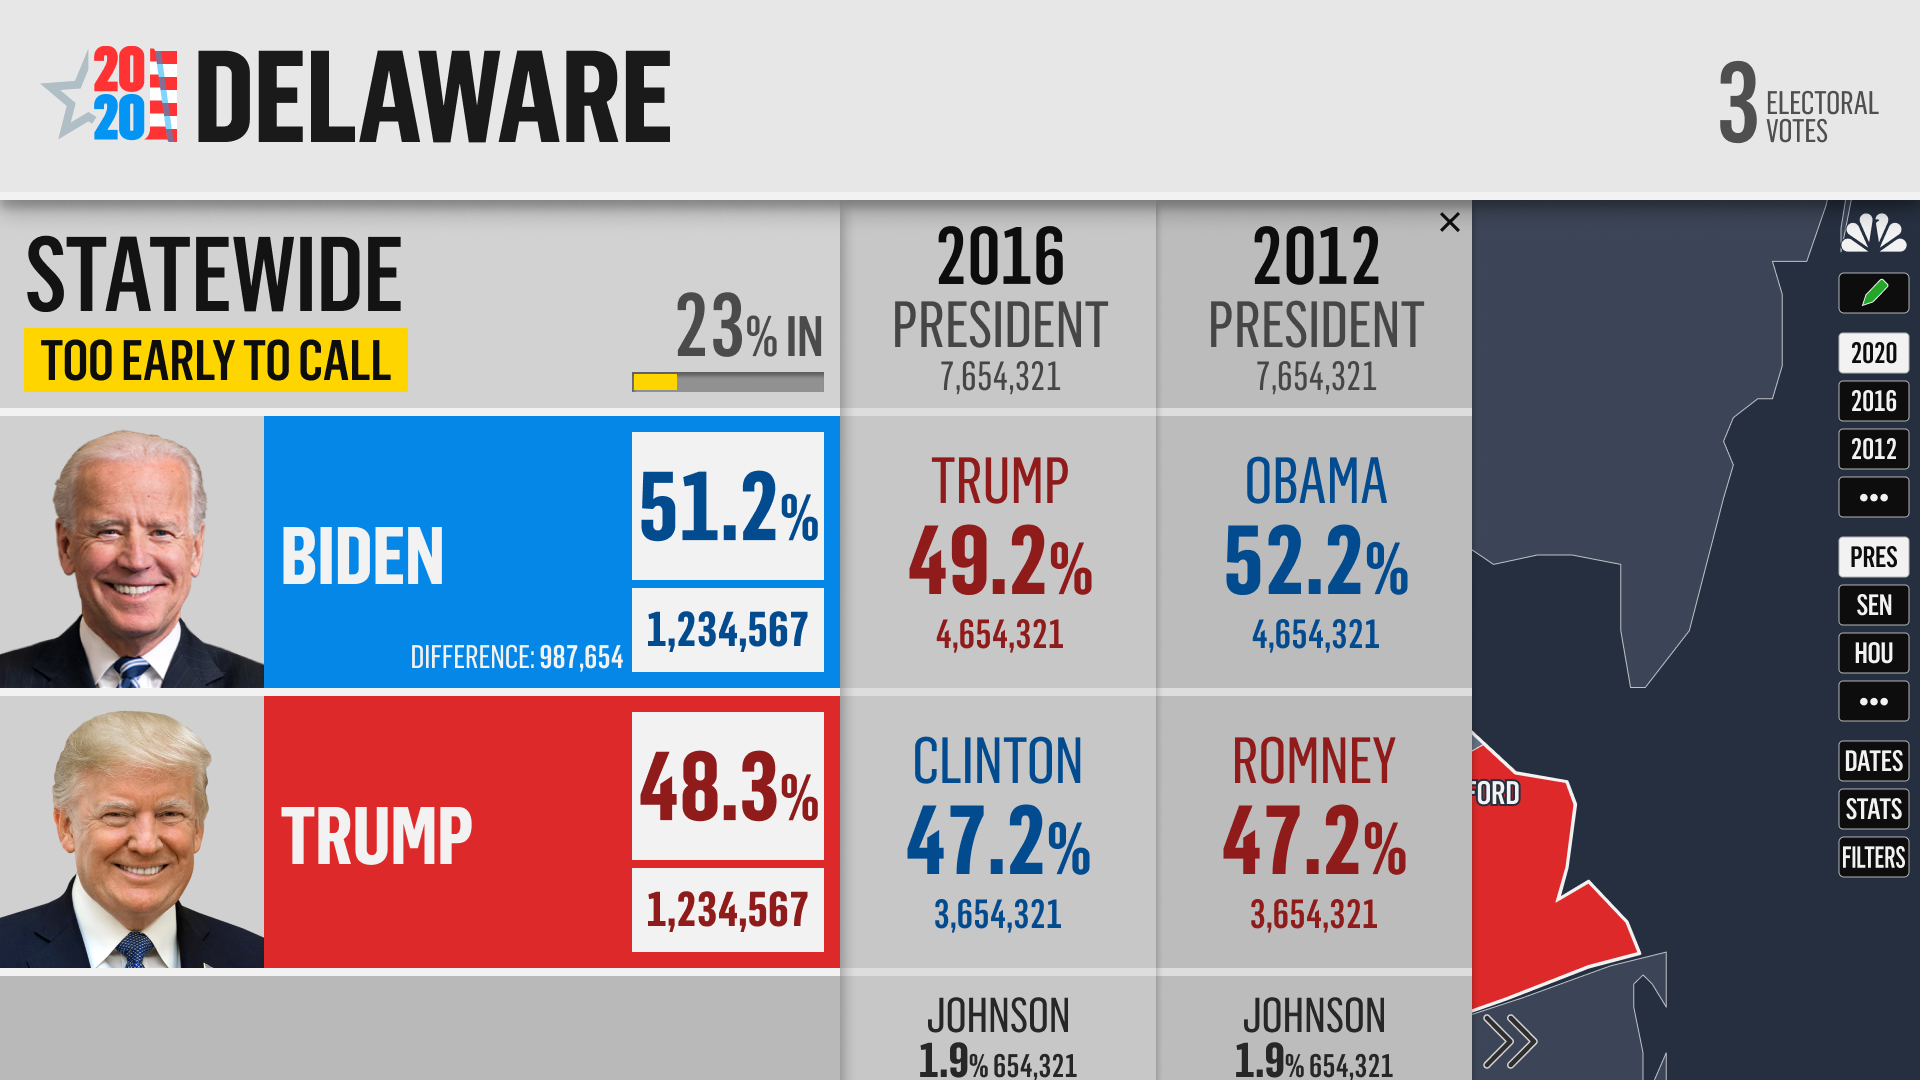
A mockup of 2 historical vote drawers opened
'What If' map
This was a hypothetical map where the on-air talent could create different scenarios that my play out on election night
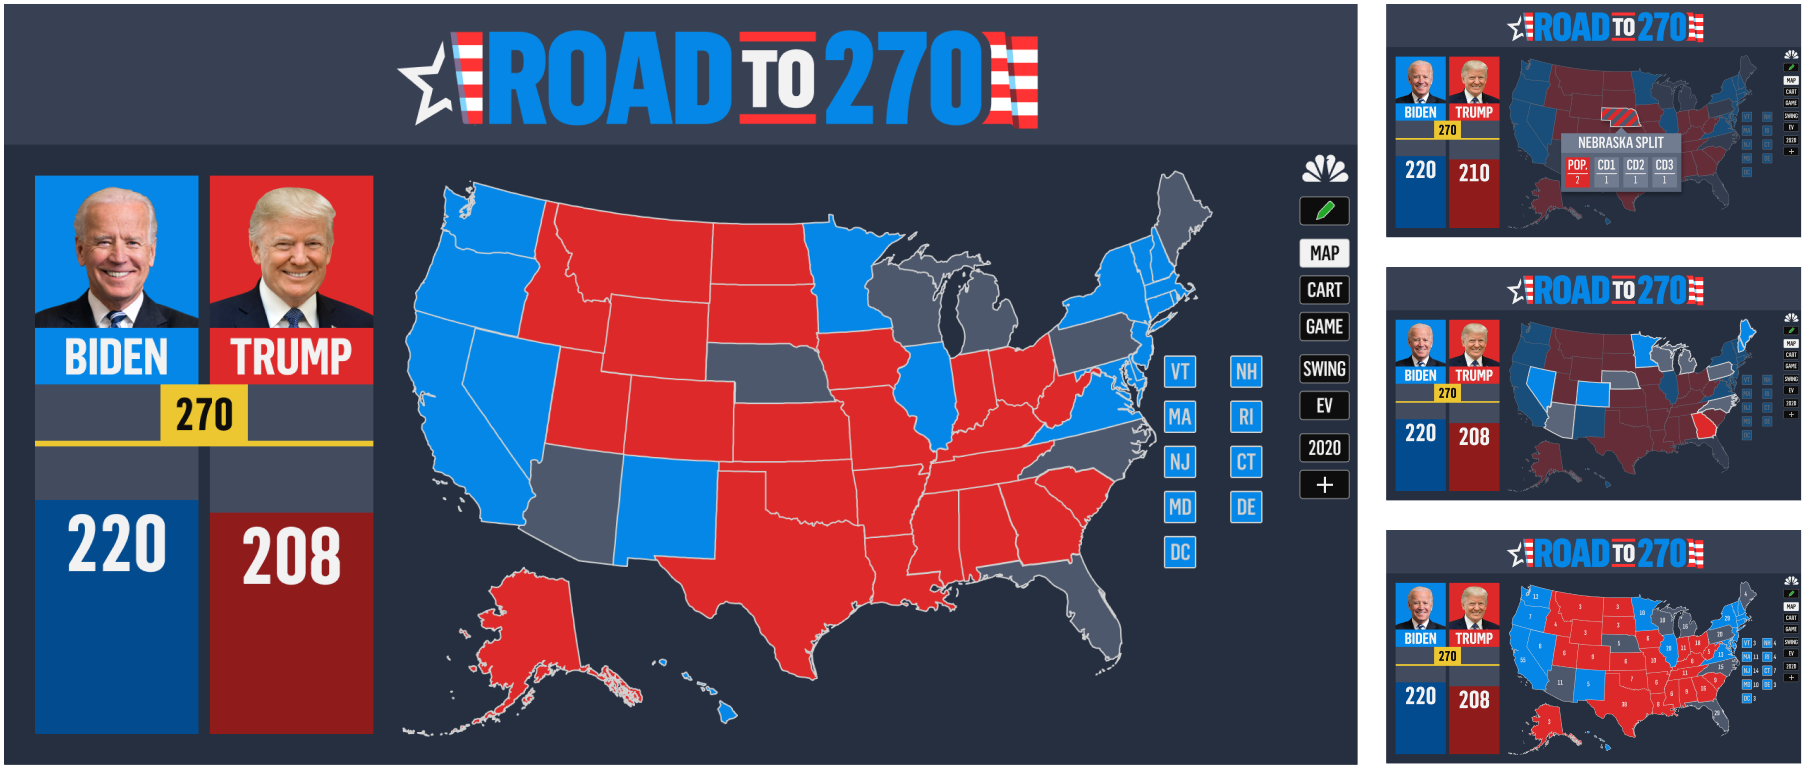
Screenshots of the hypothetical Road to 270 feature including the modal to assign electoral college votes in Nebraska, filter the swing states, and show the electoral vote values
3-Column game
This was a game where the on-air talent could present different scenarios in a different way and assign states/electoral votes to one of the 2 candidates
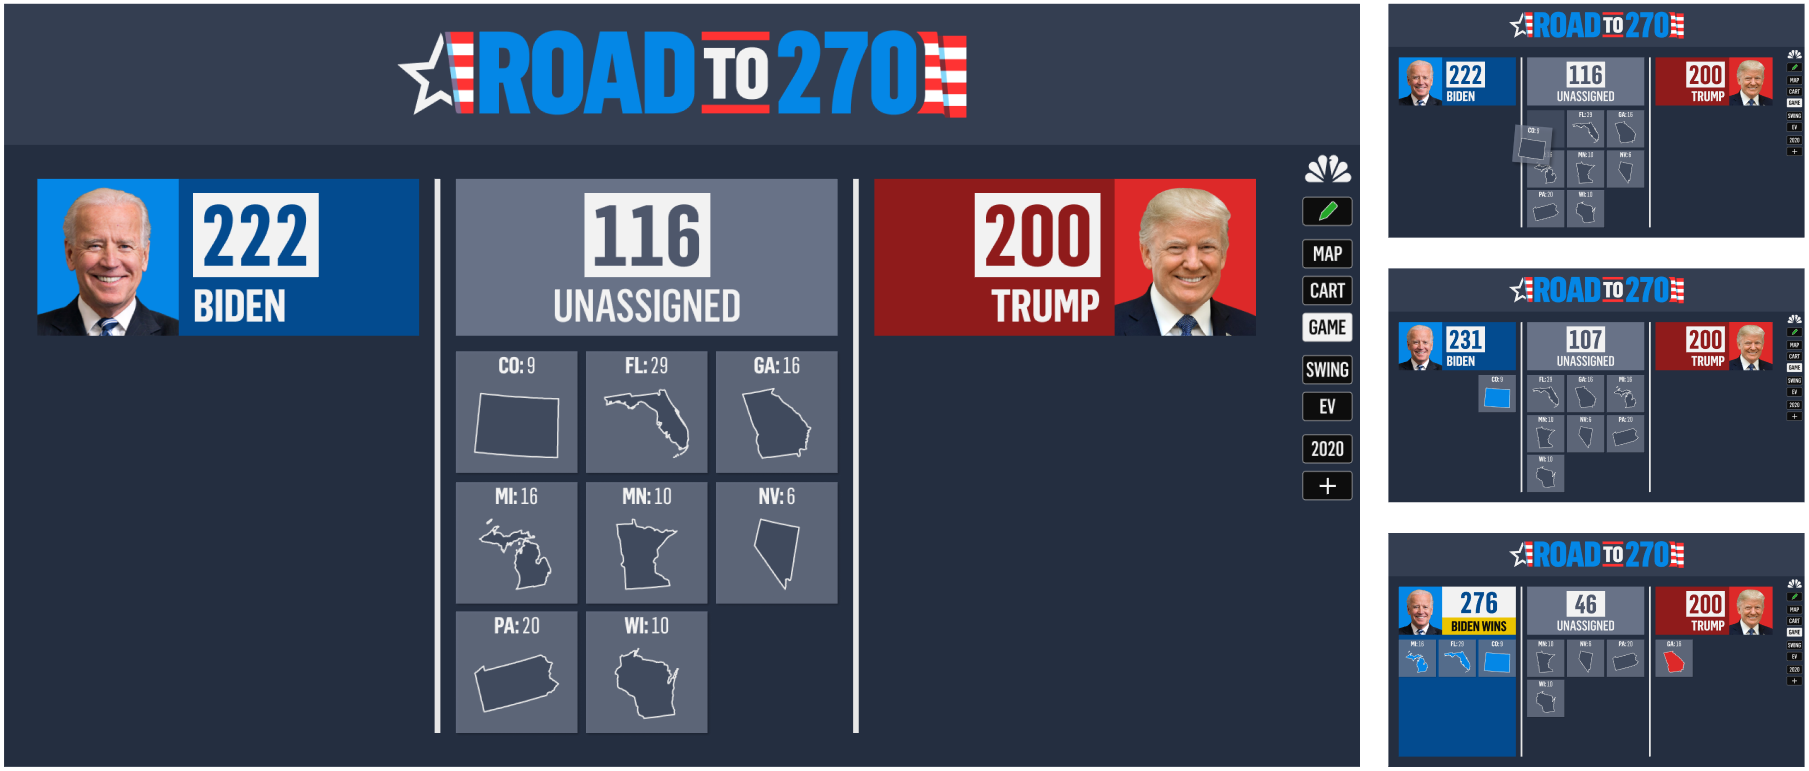
Screenshots of the 3-column game feature. Included are screens of a tile being dragged, a tile being assigned to a candidate, and a candidate reaching 270 electoral college votes
Outcome
During the 2020 election, the ‘Big Board’ became an indispensable part of NBC and MSNBC's coverage, propelled by Kornacki's masterful data analysis. He became a cultural phenomenon, and in turn, the ‘Big Board’ evolved into a widely used on-air tool, cementing its crucial role in election broadcasts. I even gave a talk about it as a speaker at Config 2021.
Here's a video of the results map; a video of the historical drawer; and a video of the 'What If' feature. It was also translated into Spanish for our Telemundo audience. You can see a video of the results map, and a video of the 'What If' feature. And lastly, Steve Kornacki became a cultural icon in 2020, partly thanks to Leslie Jones's viral social media videos, like this one.
Here is a slide deck of this case study