State Page Experience for Elections​​​​​​​
Overview
The challenge: during election season, people need quick, detailed, and state-specific election information, both on and before election night.
The opportunity: This presented a chance to establish NBCNews.com as the go-to source for state election data. We aimed to create a trusted destination for users seeking comprehensive election information before, during, and after election night, thereby attracting and retaining them.
My role and timeline
I was the sole Product Designer for all of the designs on the state pages, with some guidance from my manager. 
Timeline: 3-4 week design phase
Development: Around 2 months for implementation
How might we... 
Best show important election info to users on election night and the days leading up to it?
Research: competitive analysis of state election information presentation
To come up with a solid design plan, we checked out what other news sites were doing with state election info. Our goal was to find out what works best and how we can stand out. Here are the key findings:

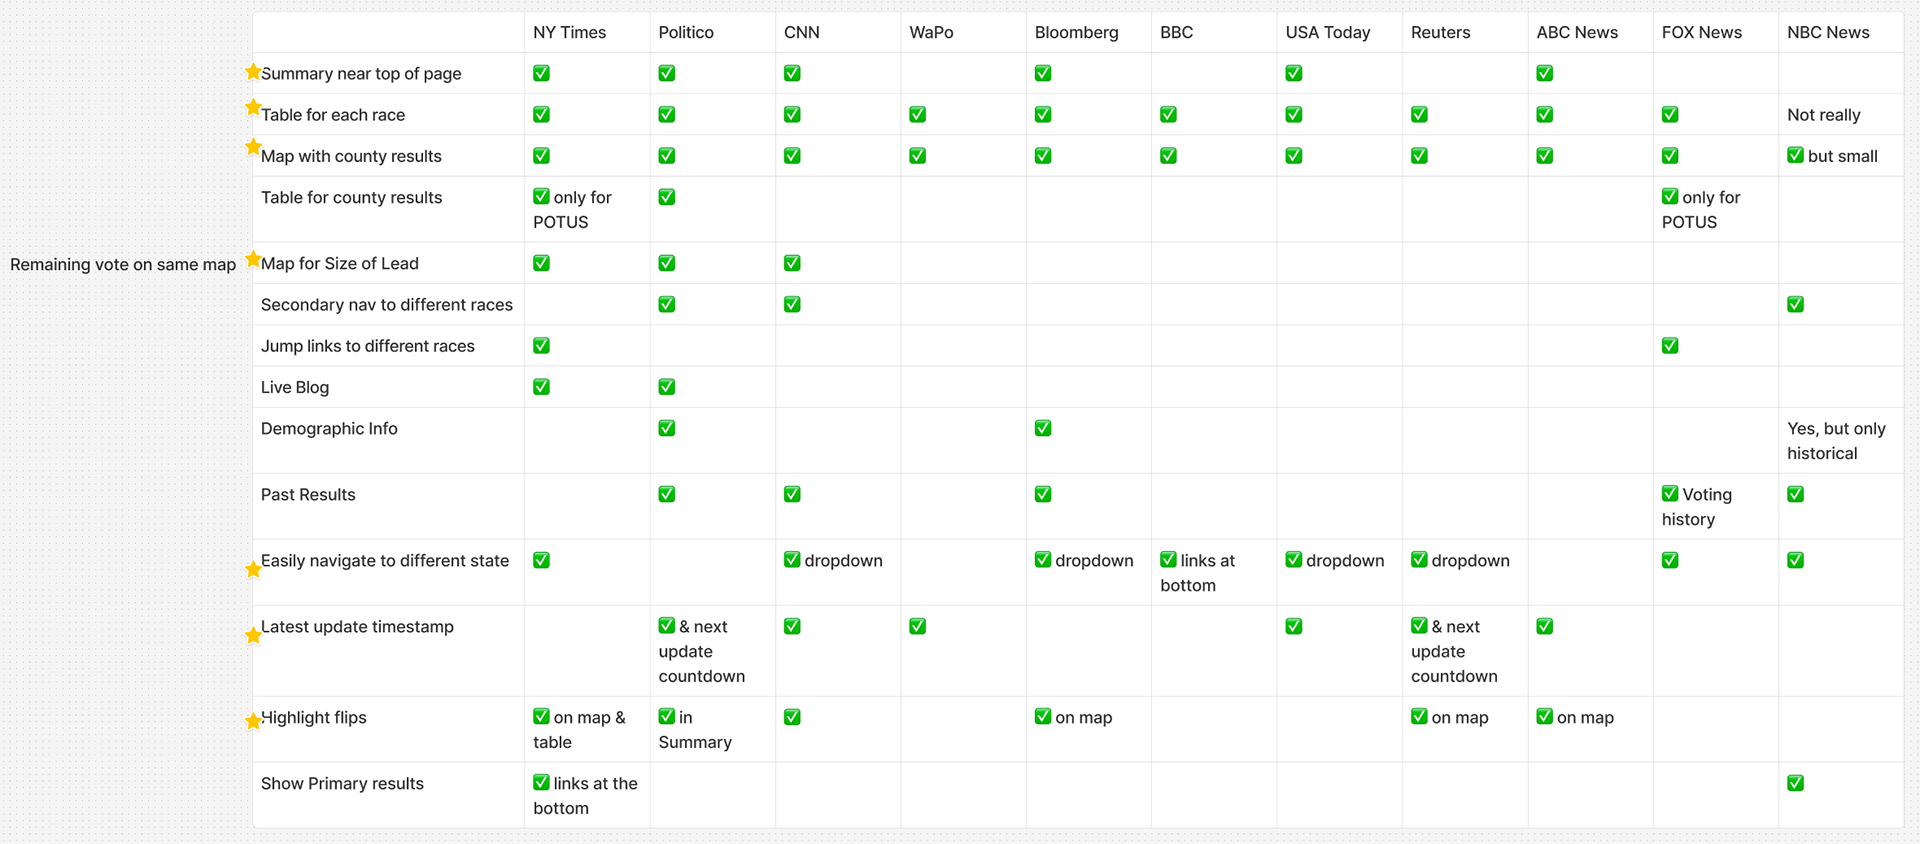
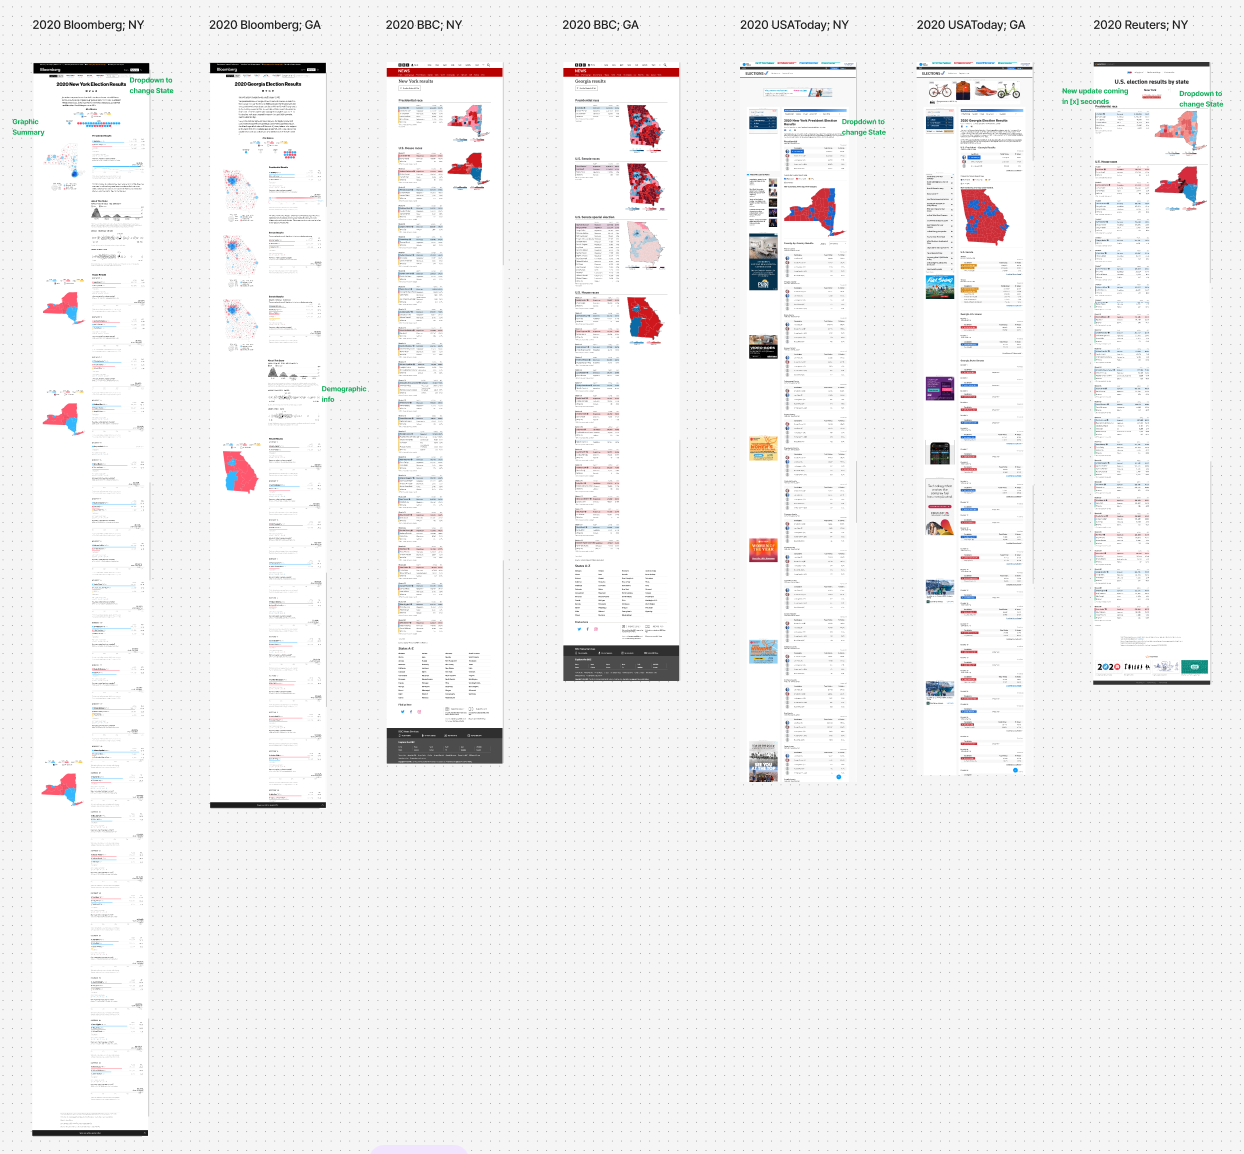
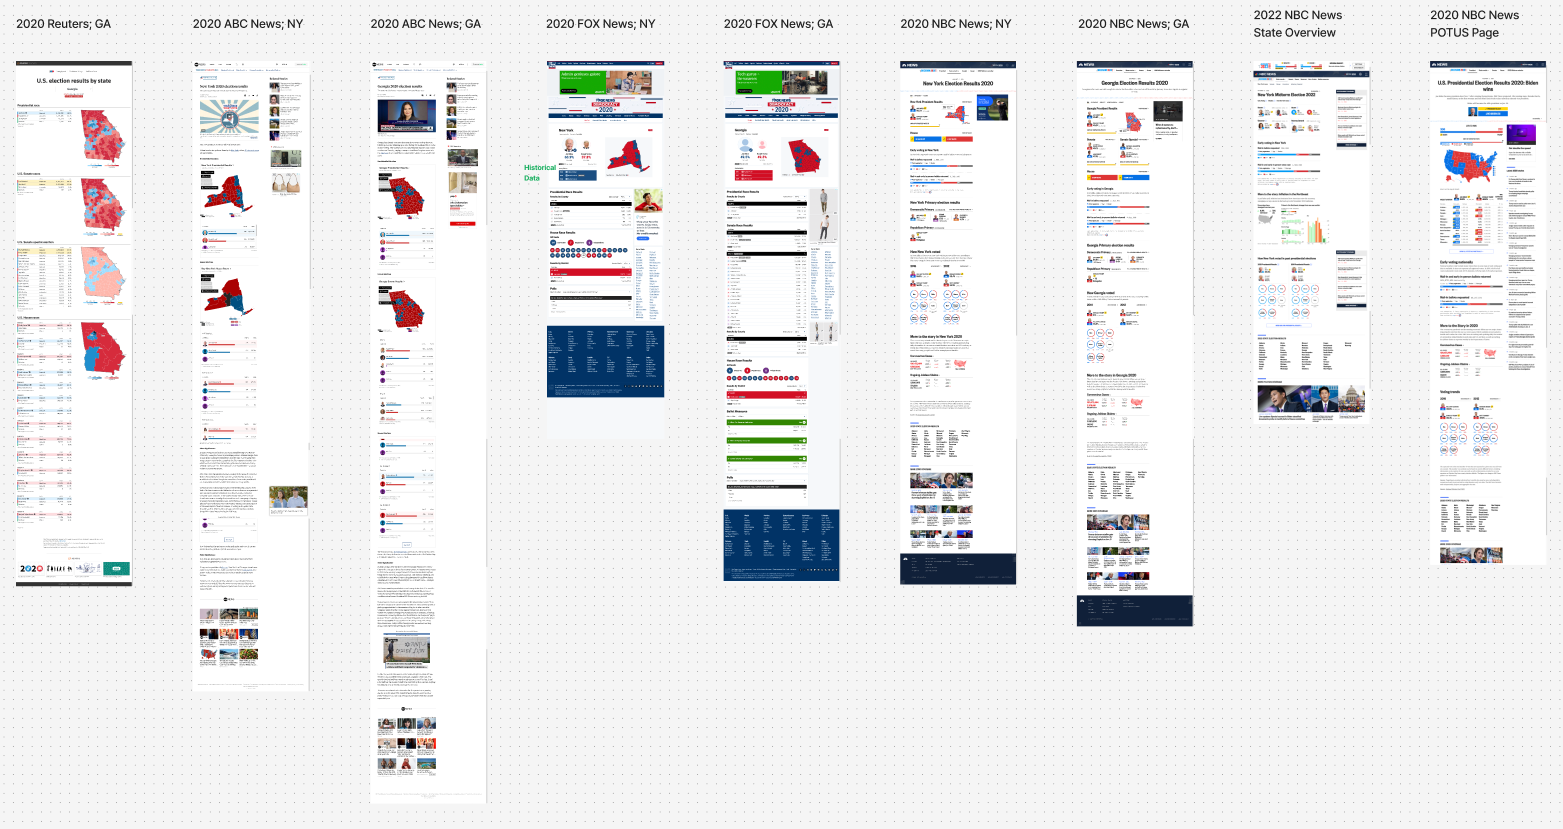
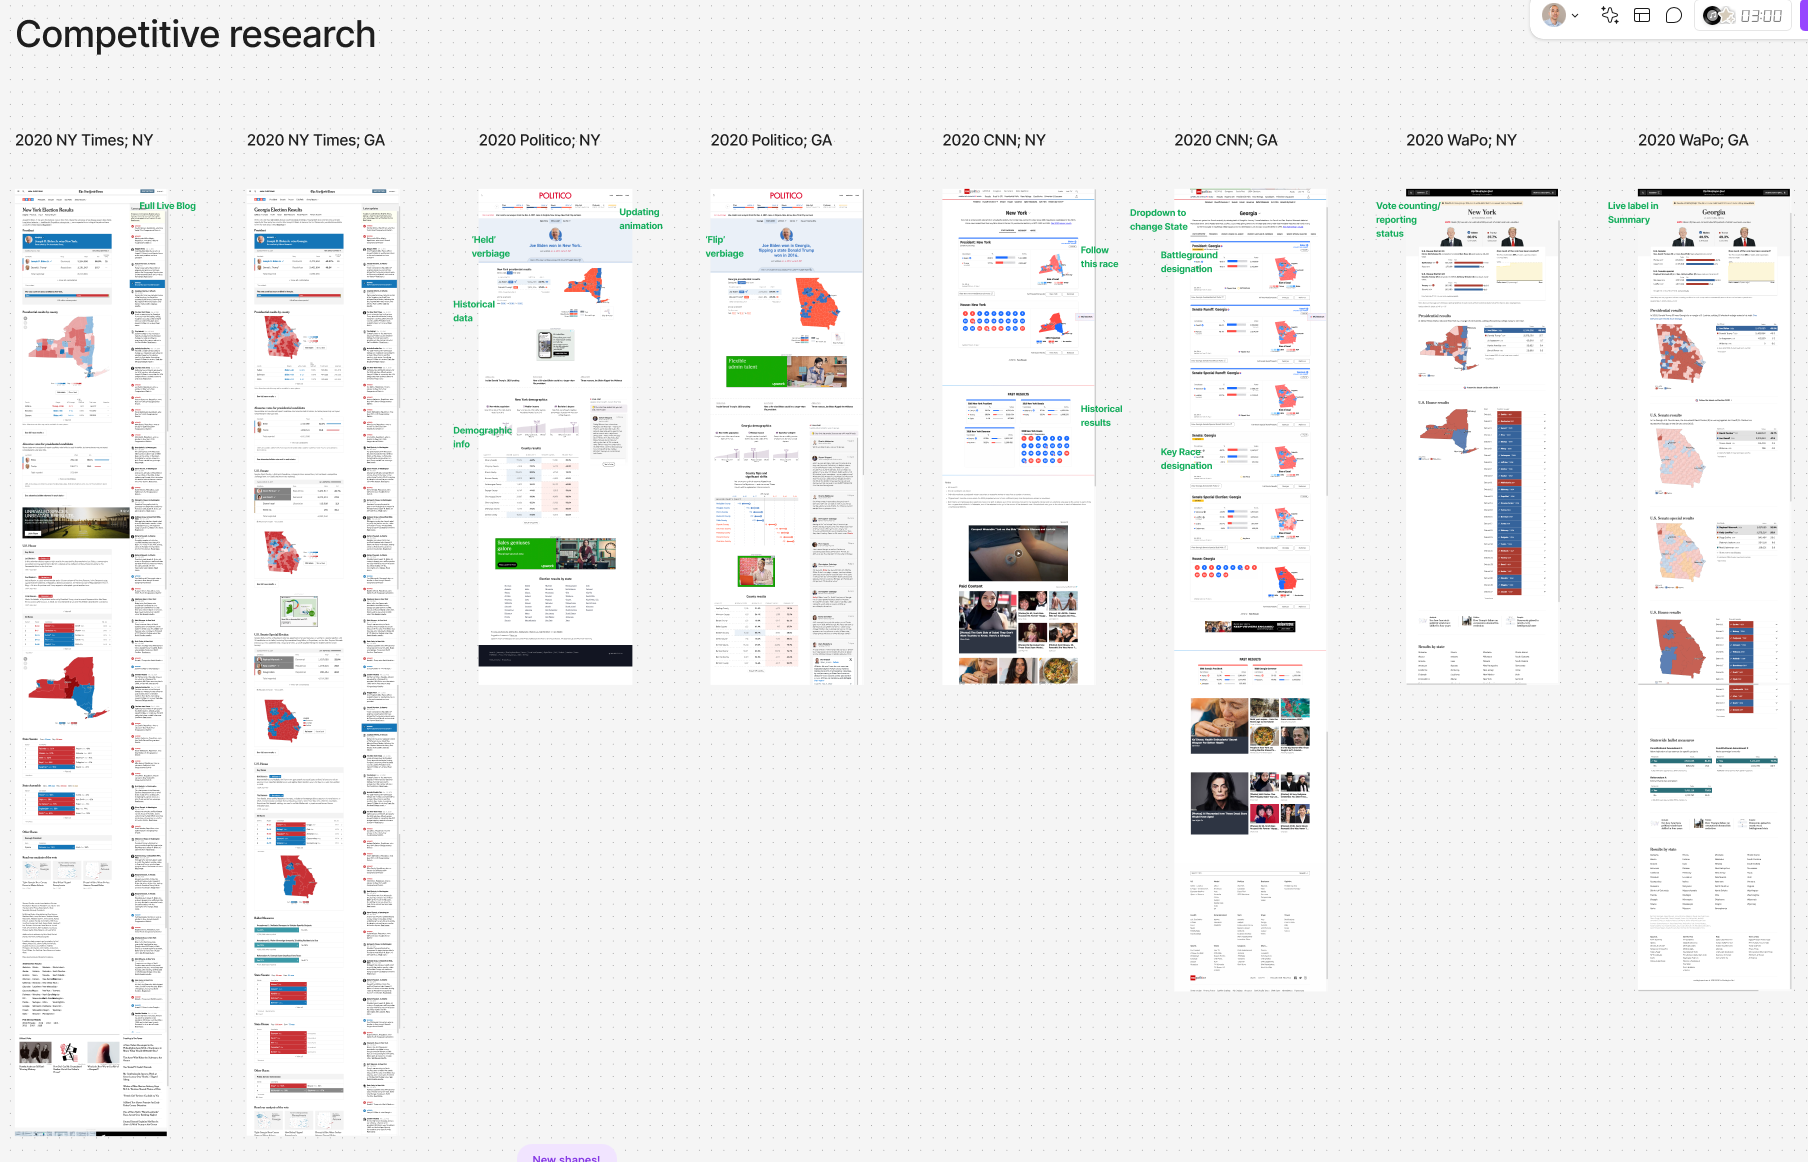
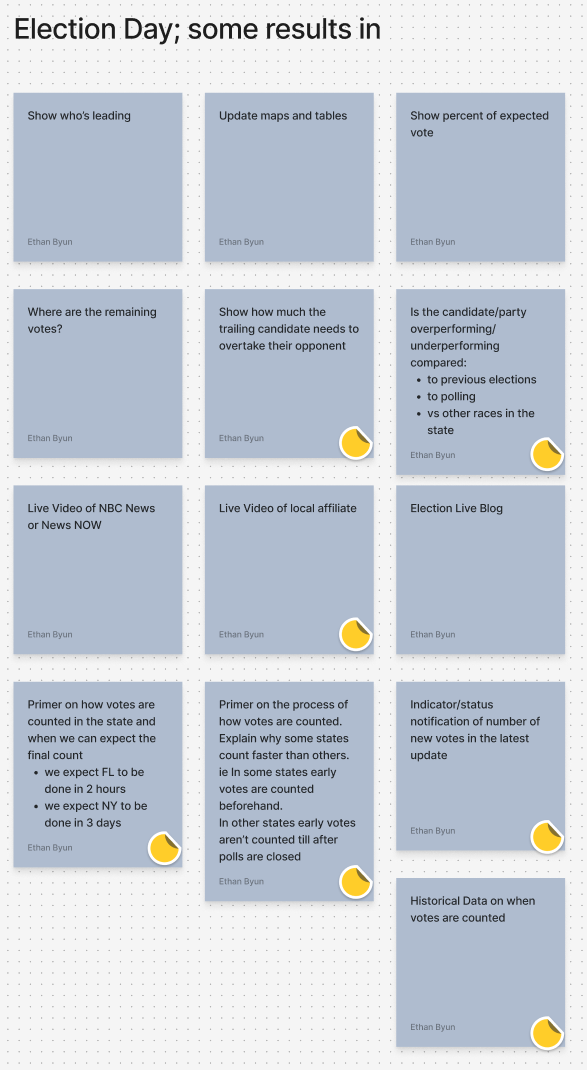
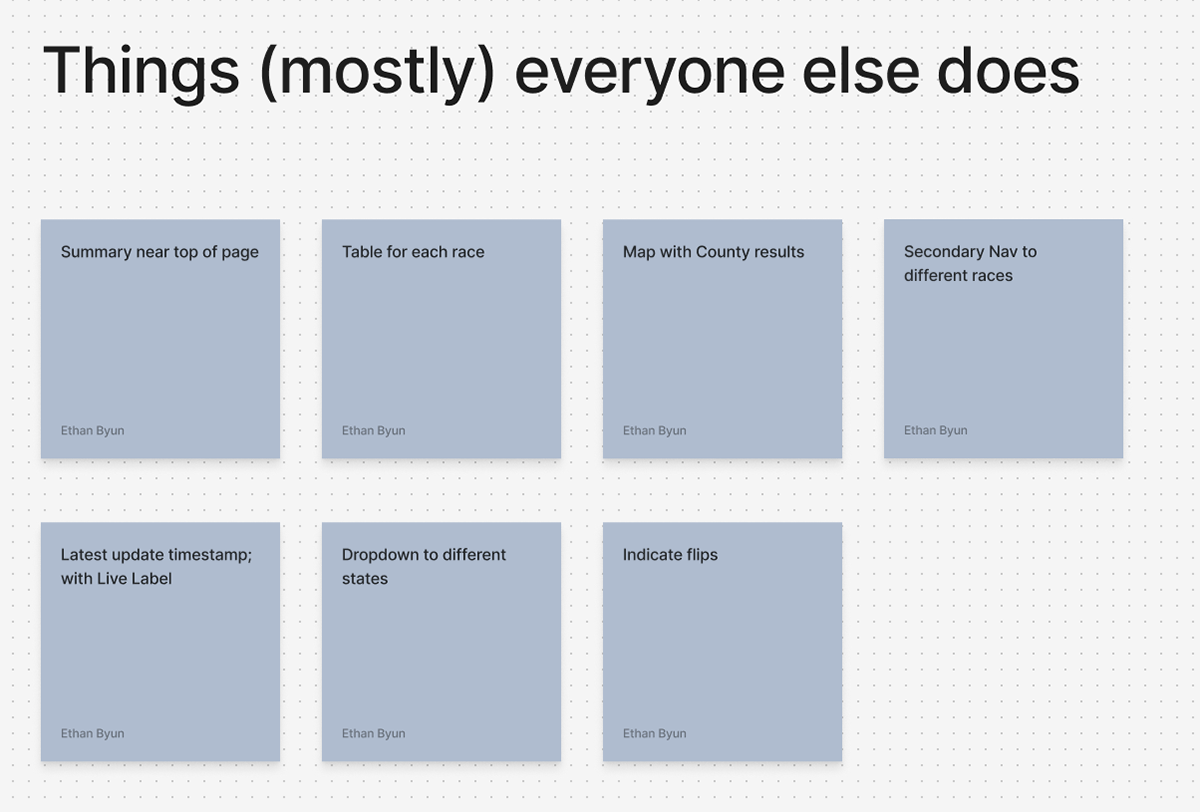
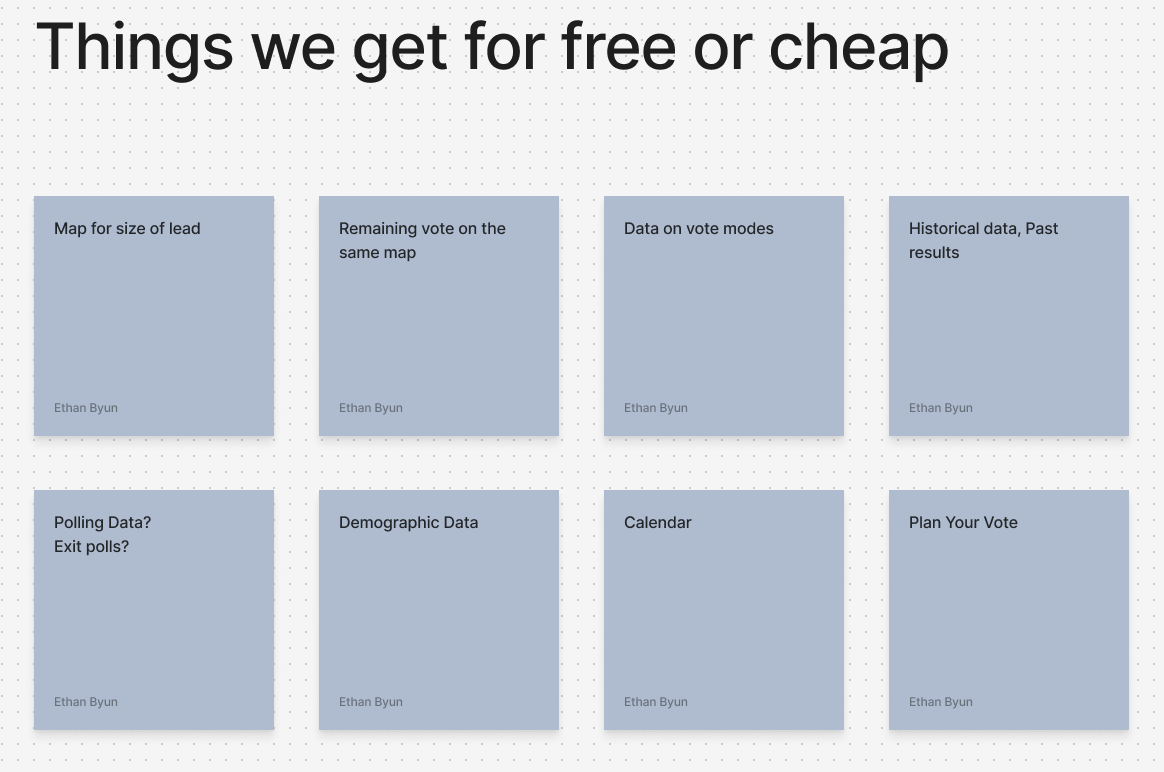
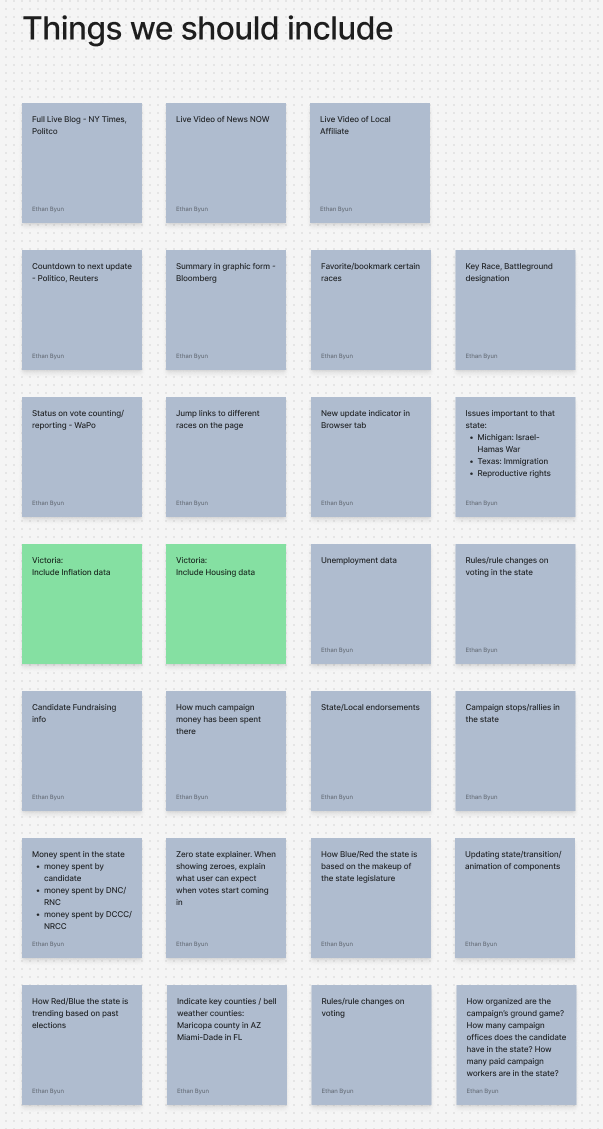
A table of our competitive research findings

And here are the personas that our research team developed:

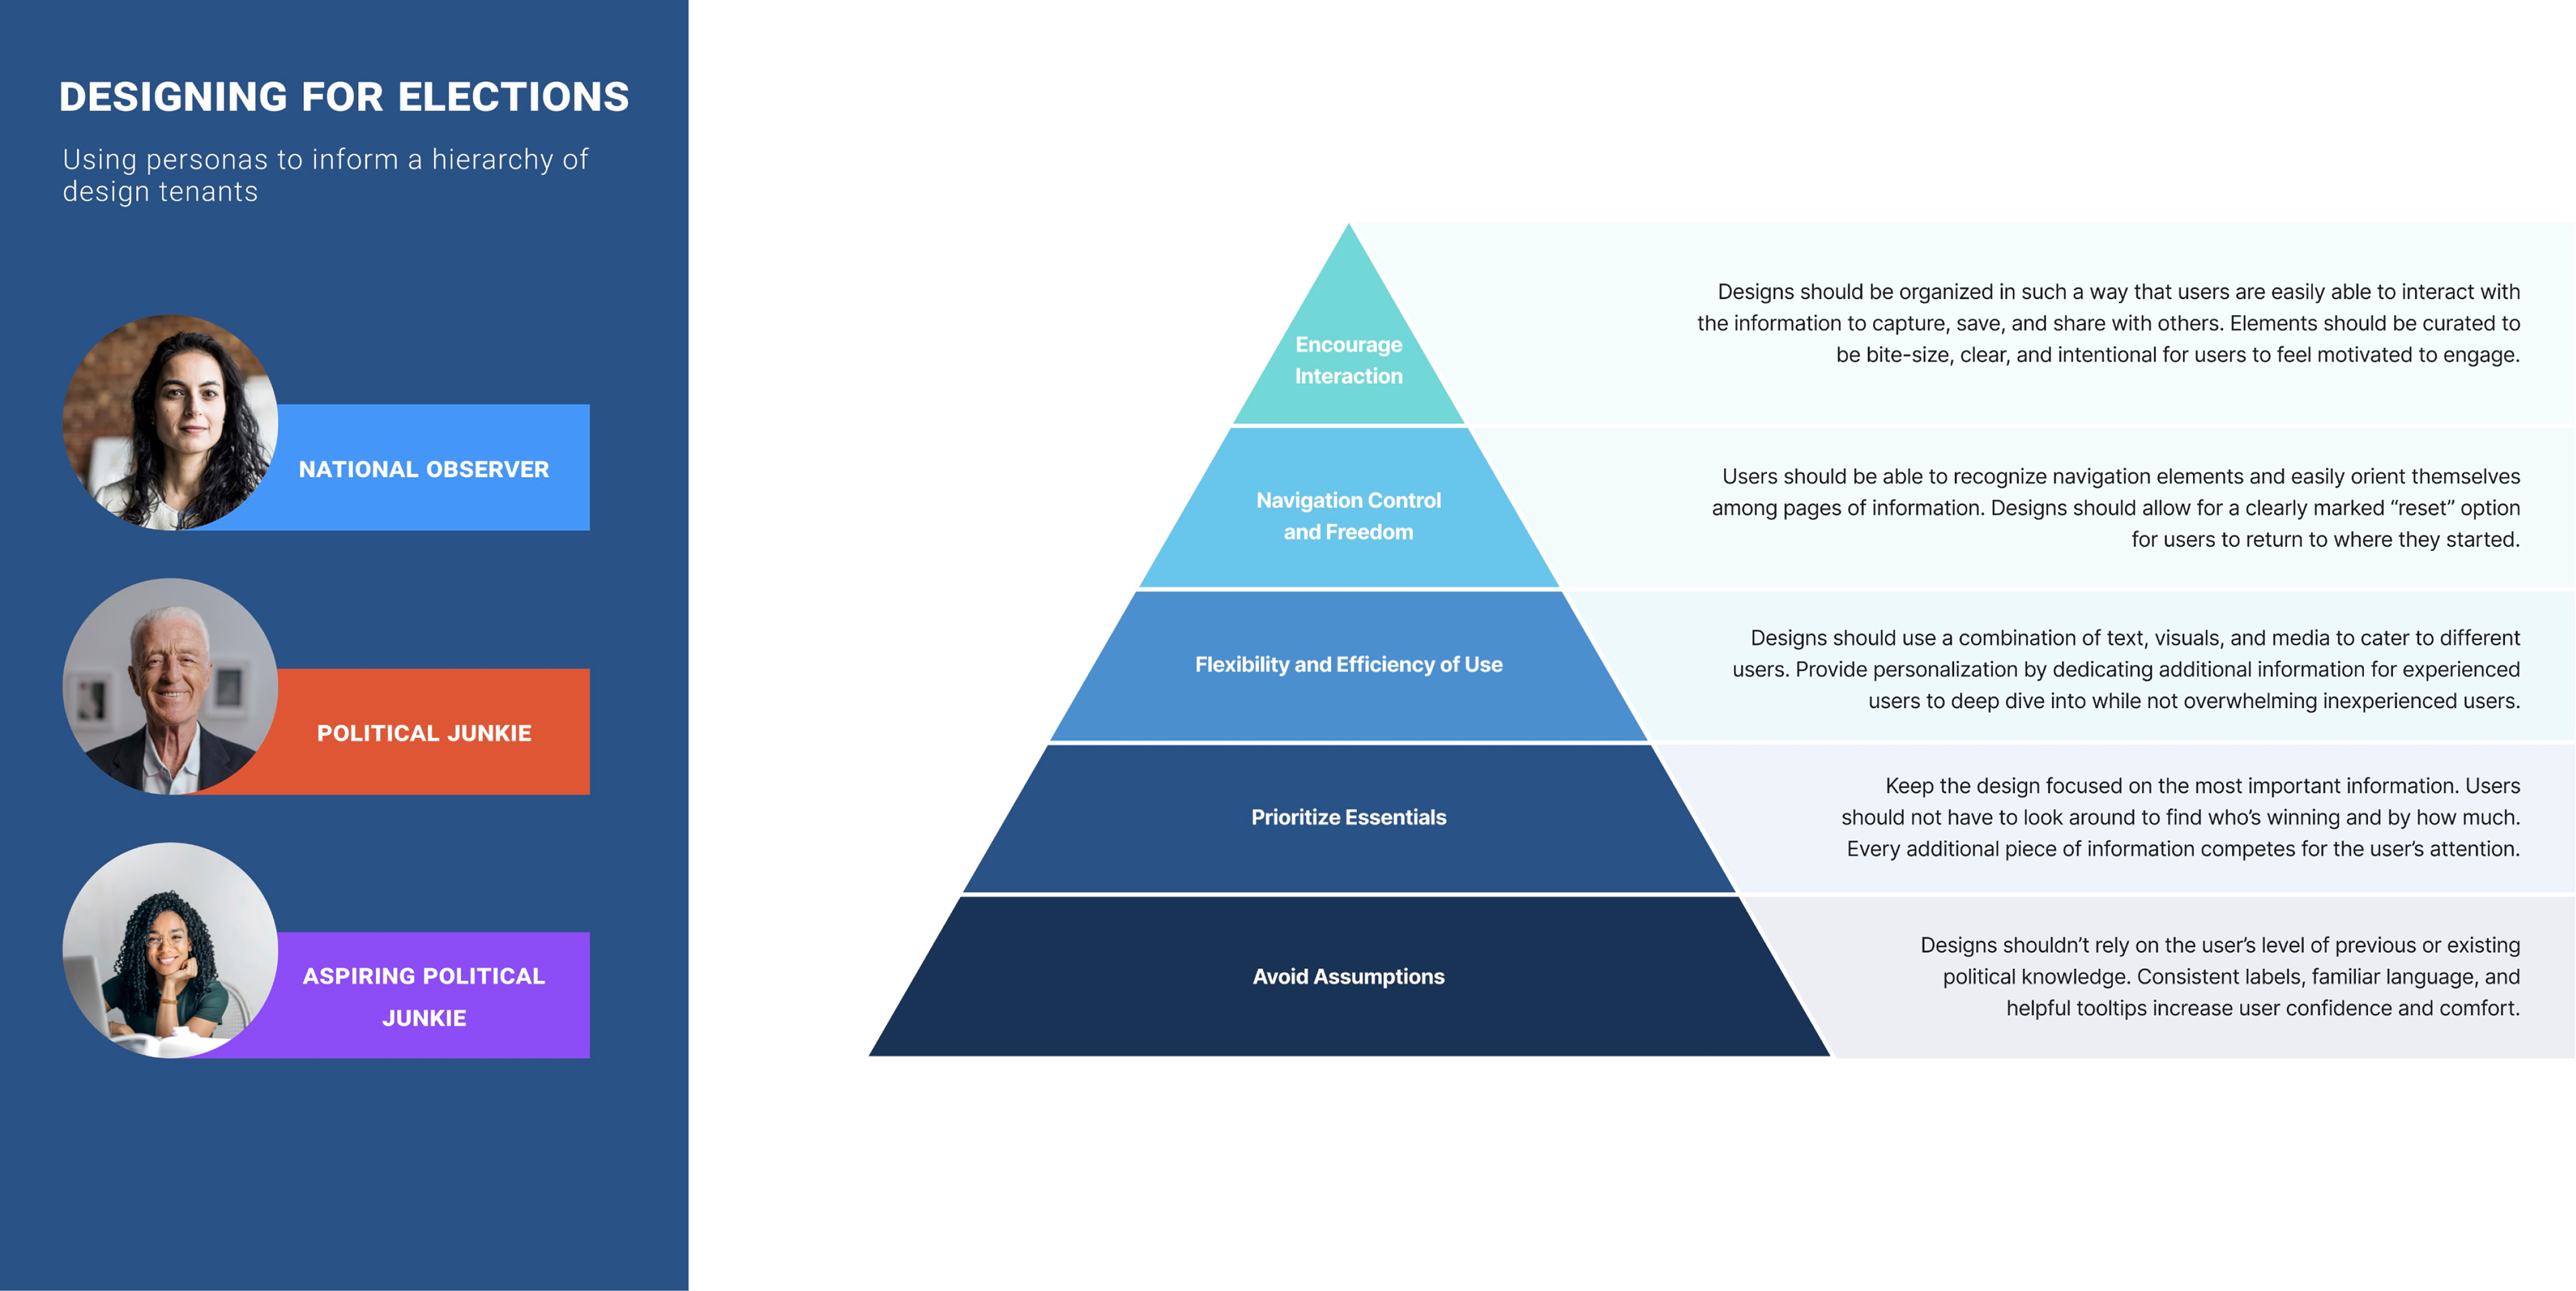
Our three election personas

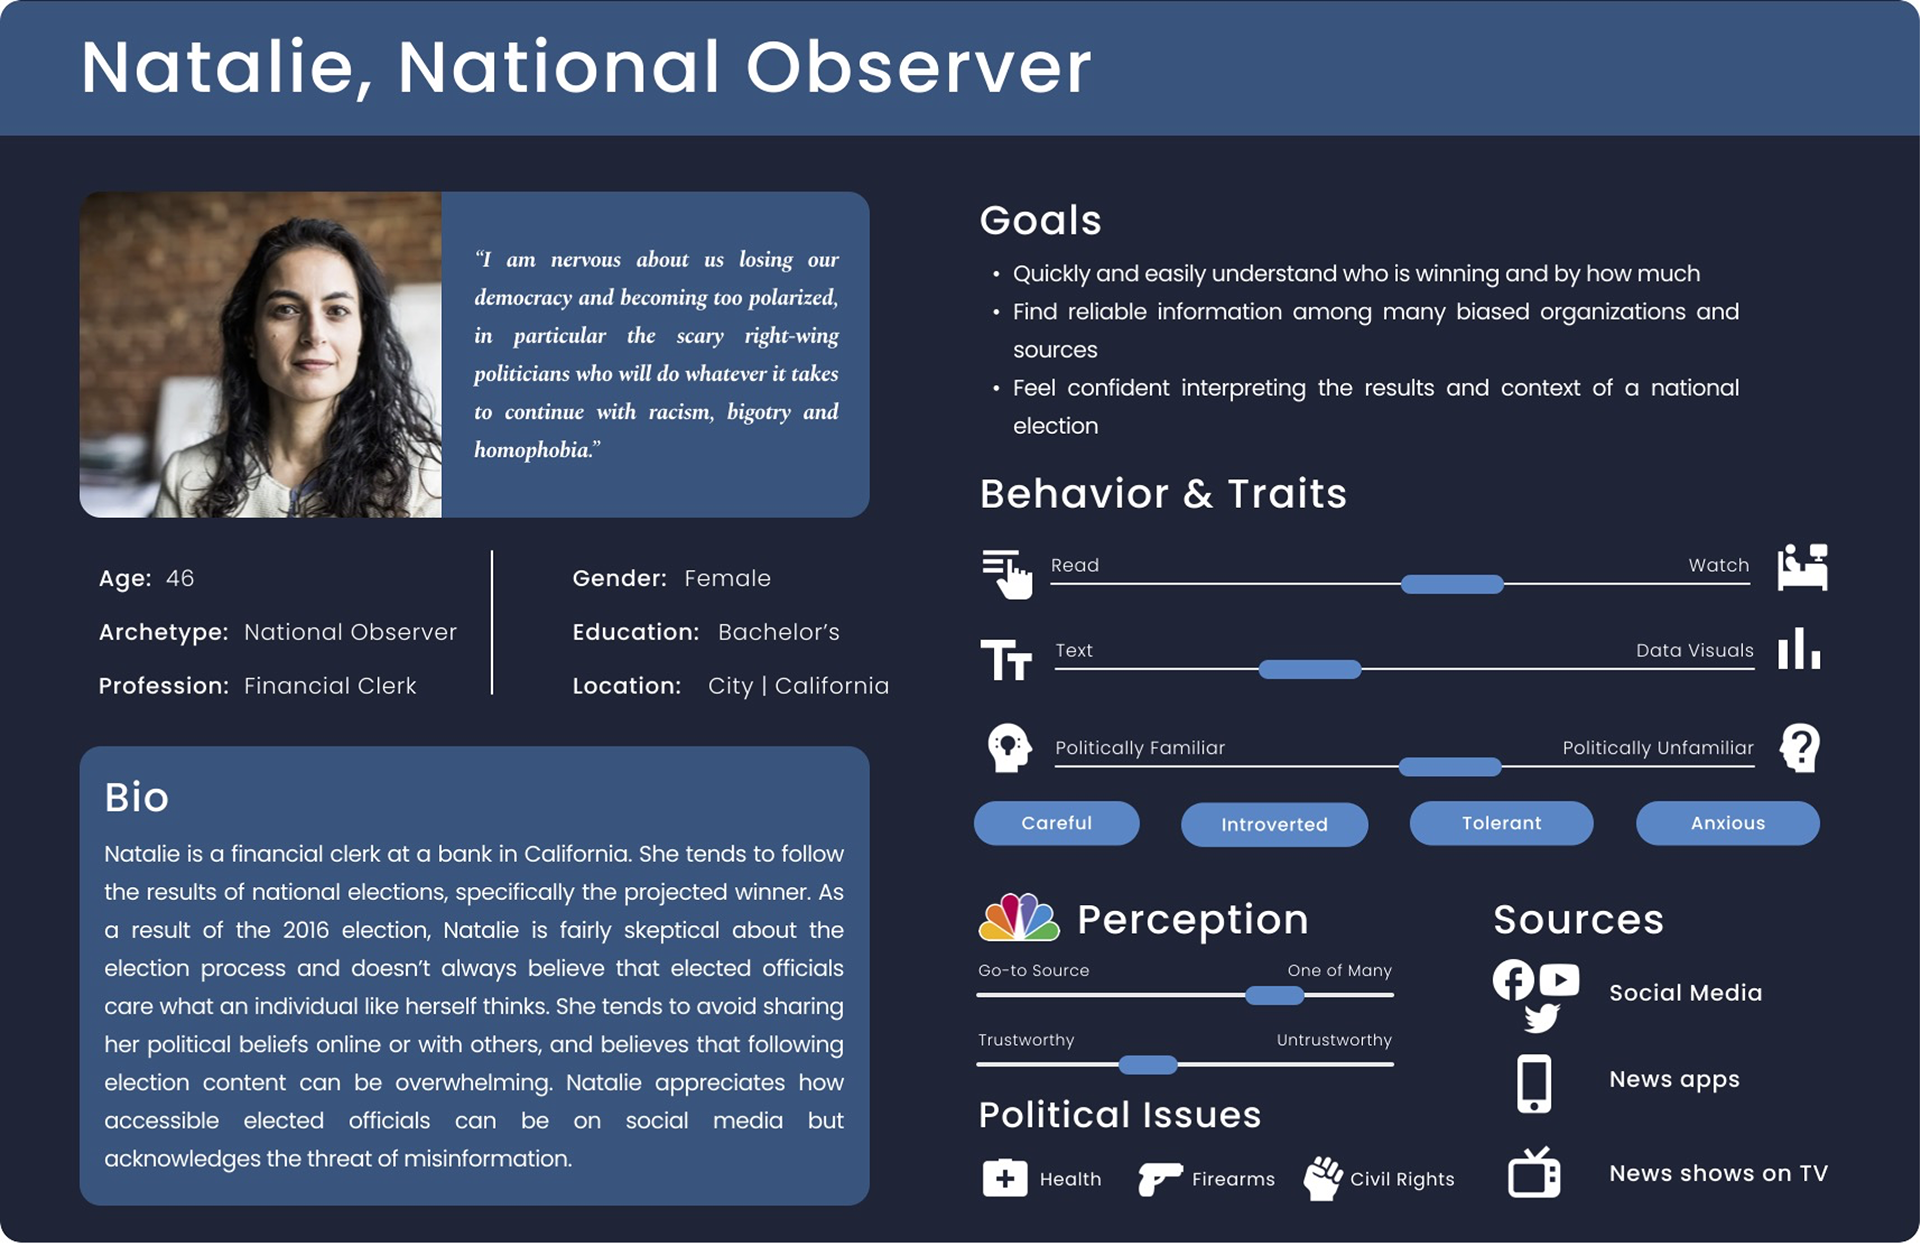
Natalie, our National Observer

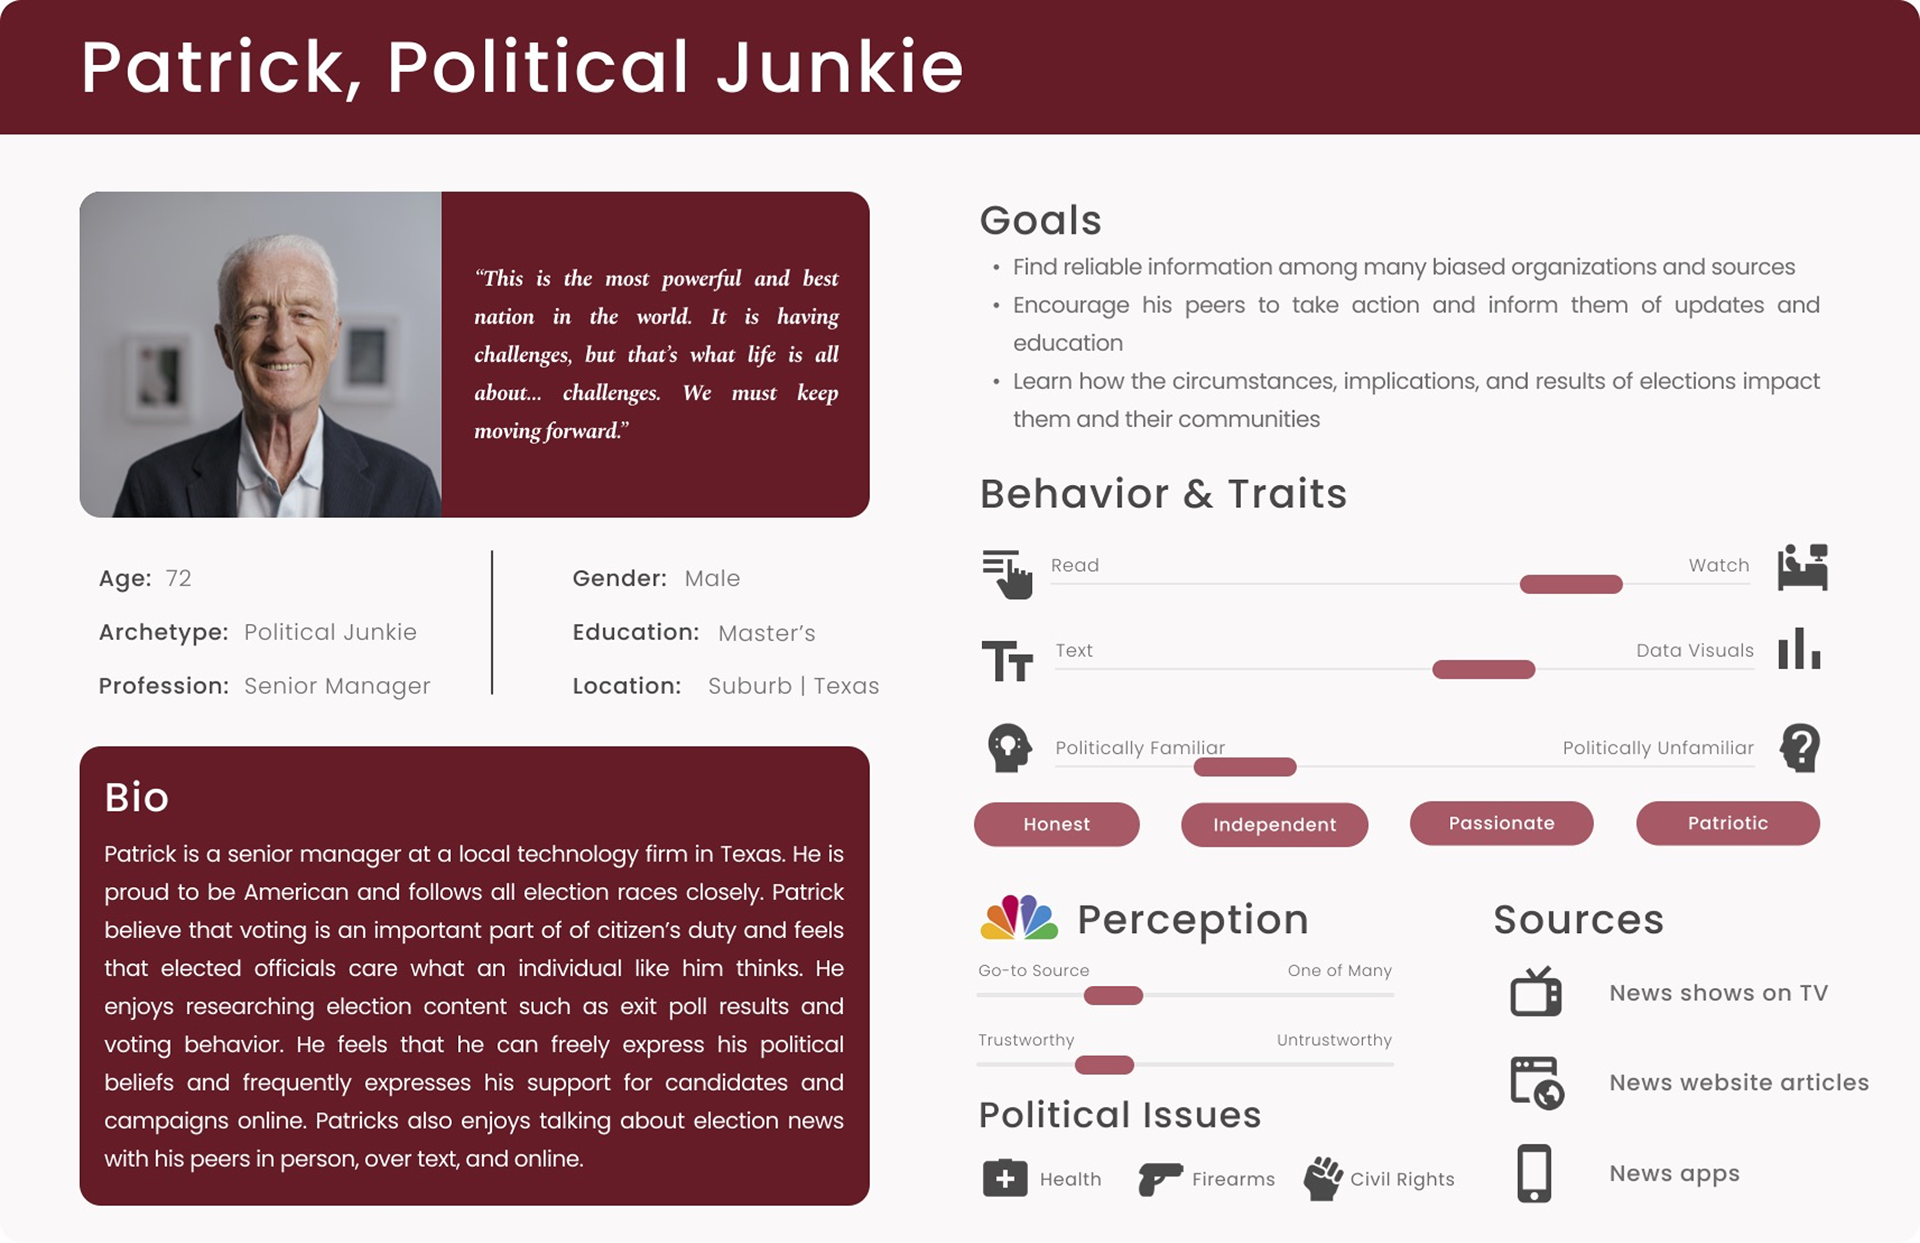
Patrick, our Political Junkie

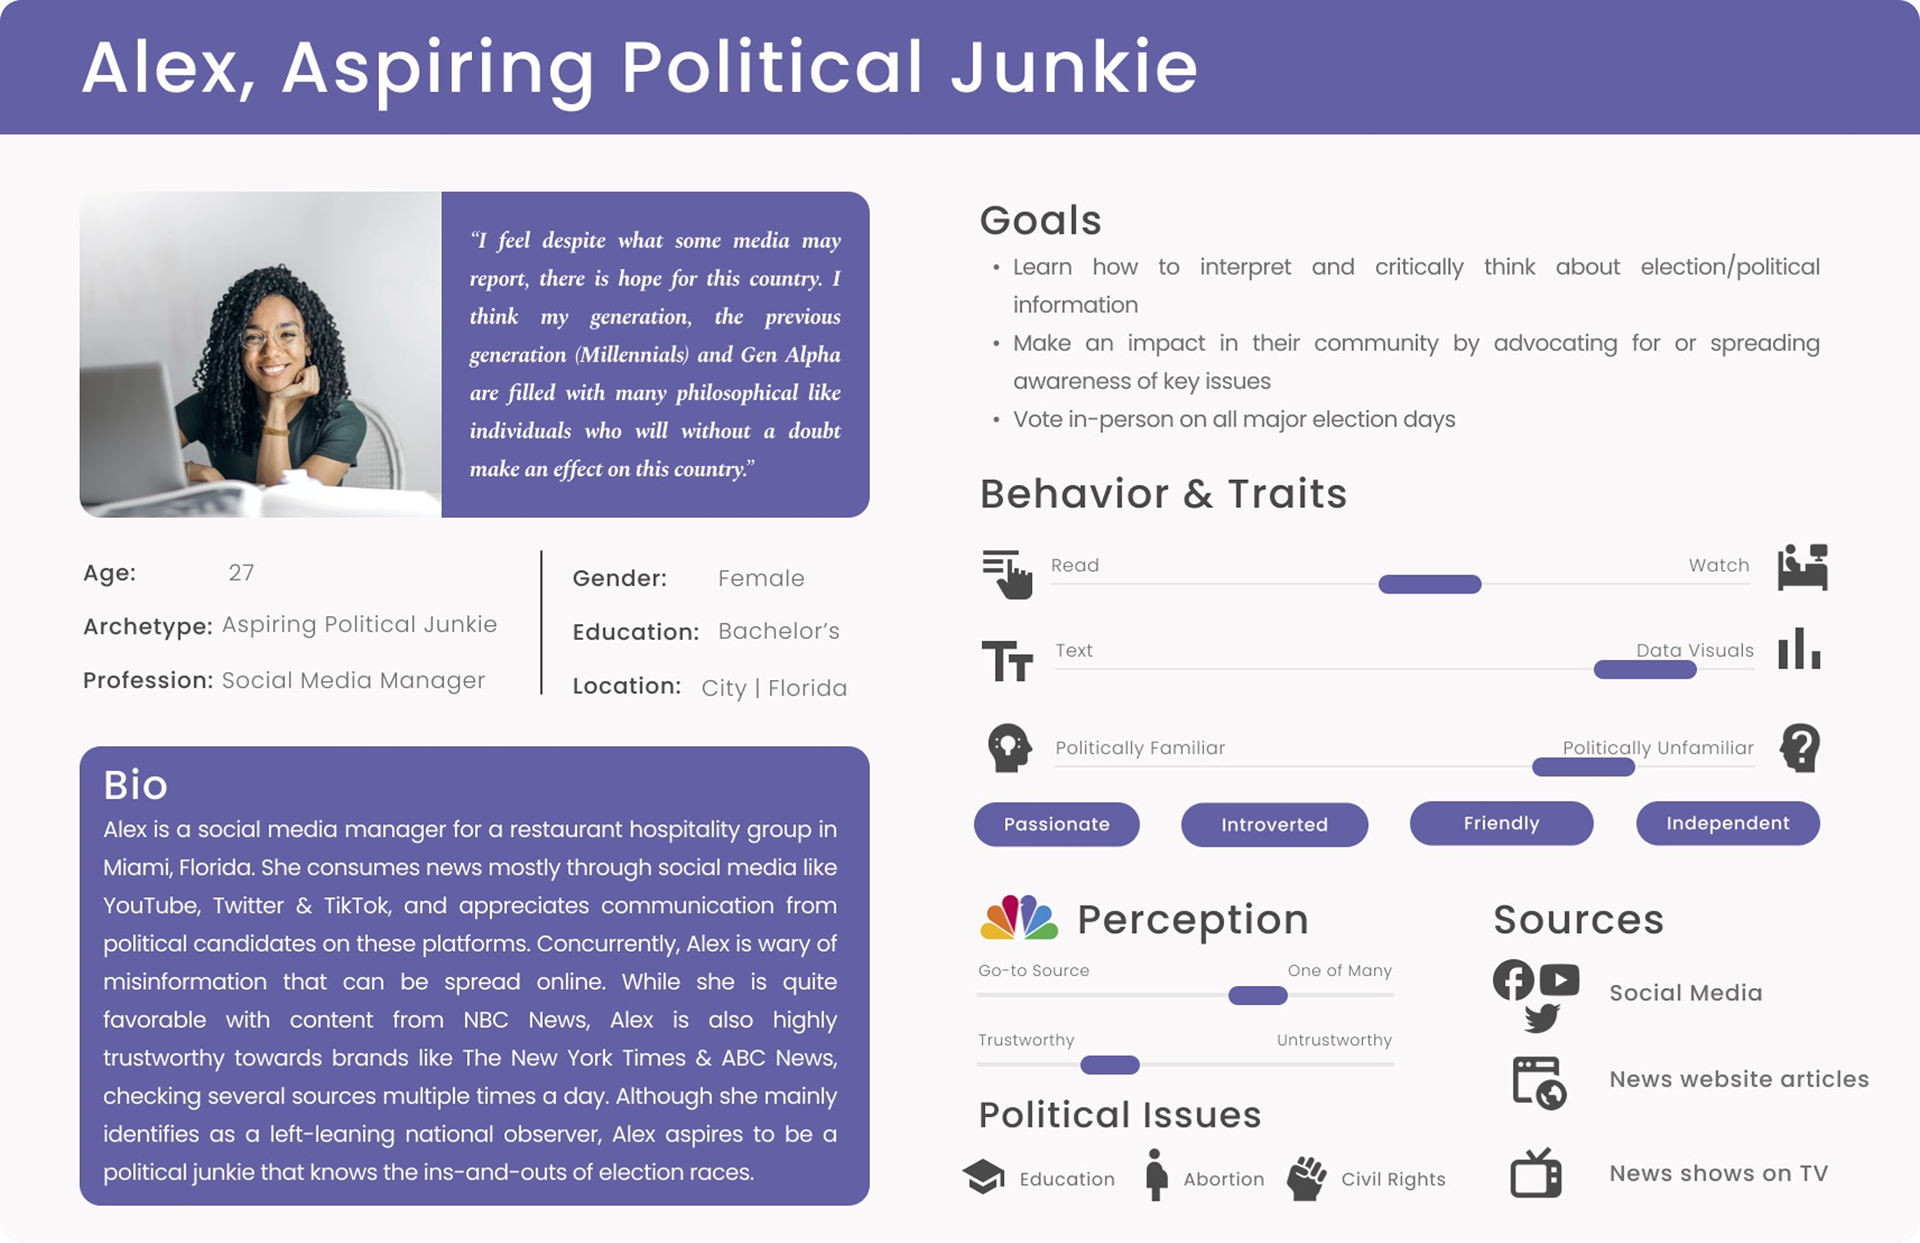
Alex, our Aspiring Political Junkie

Our Solution: Key features based on what users want
Here are the features we chose to help users easily find state election info:
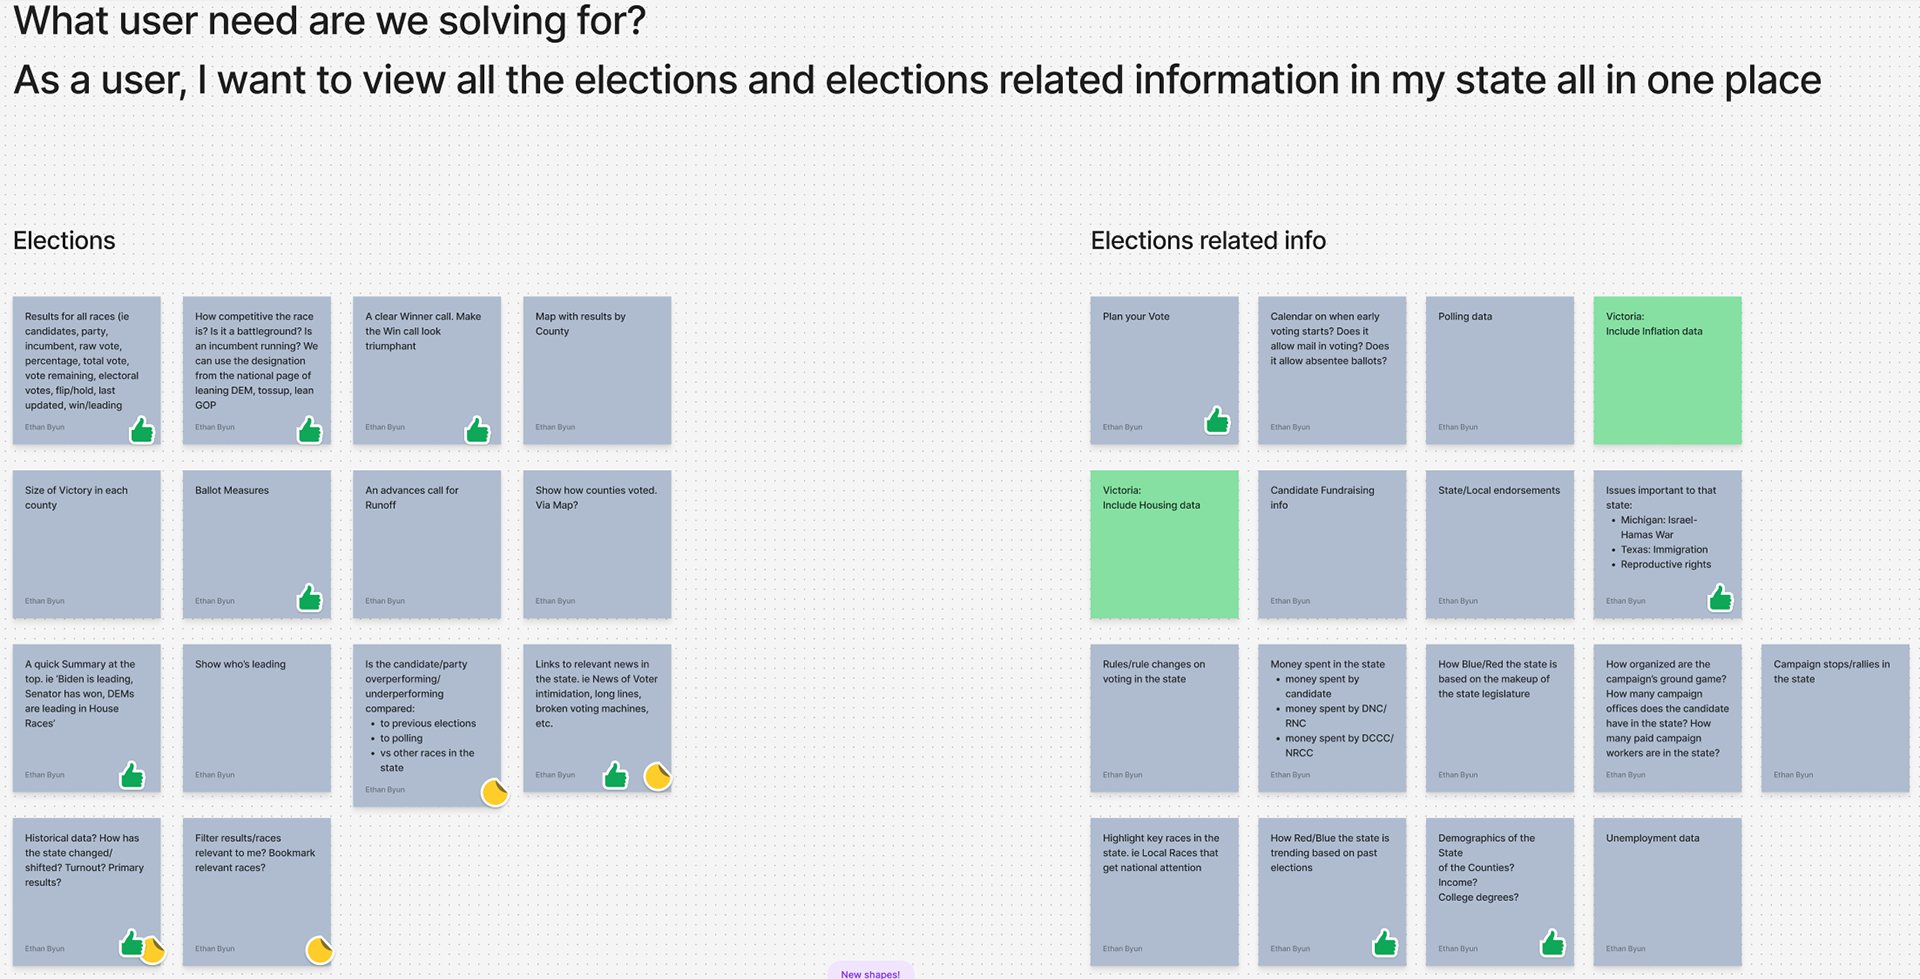
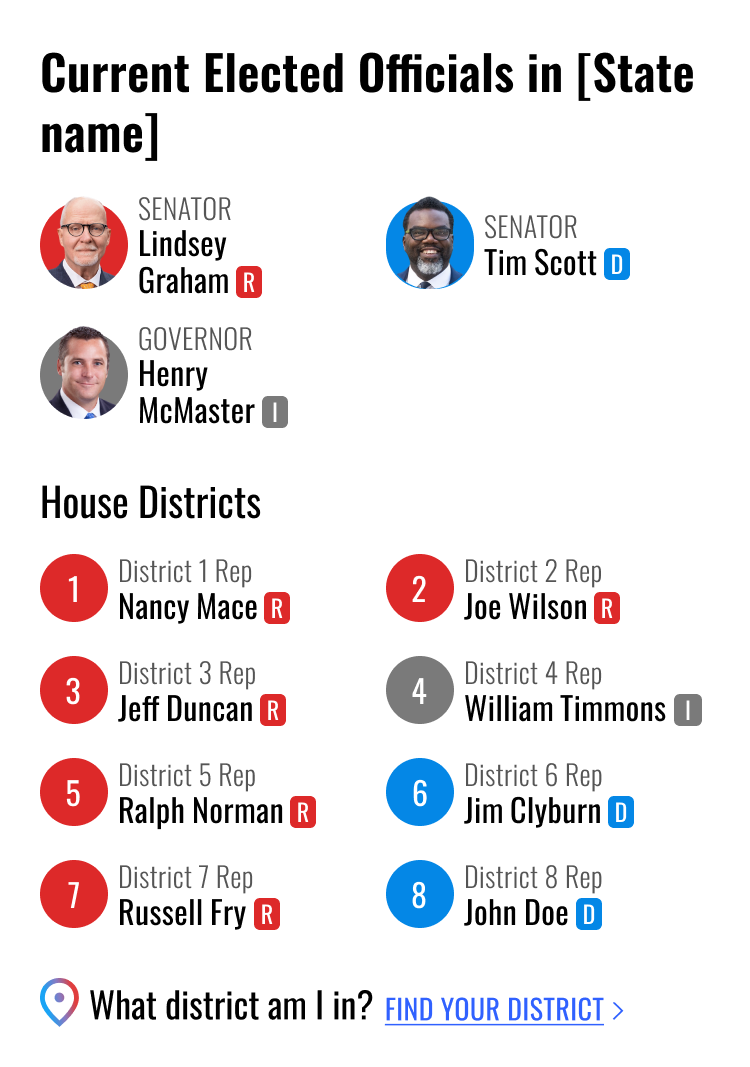
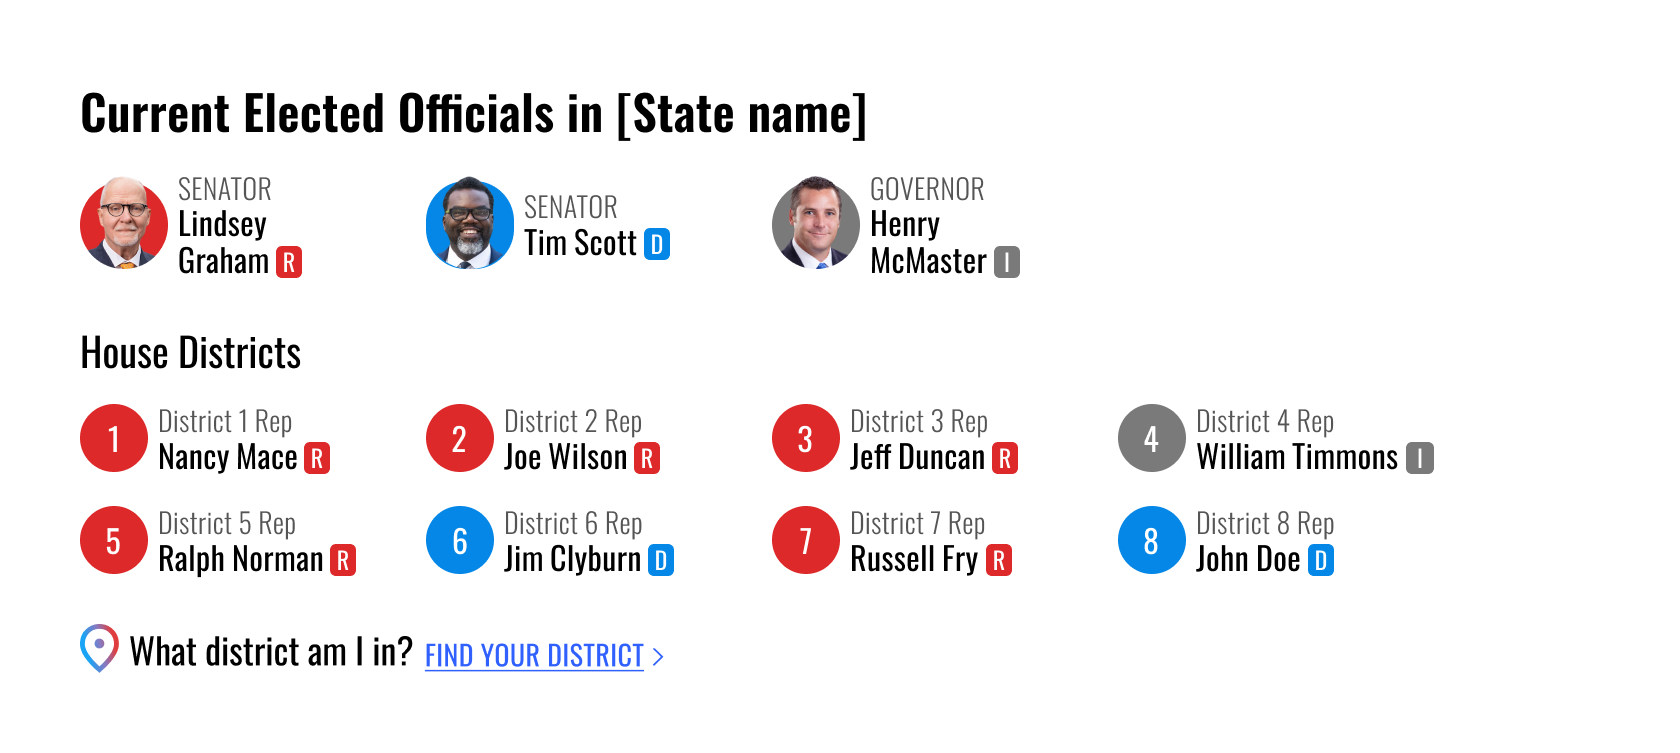
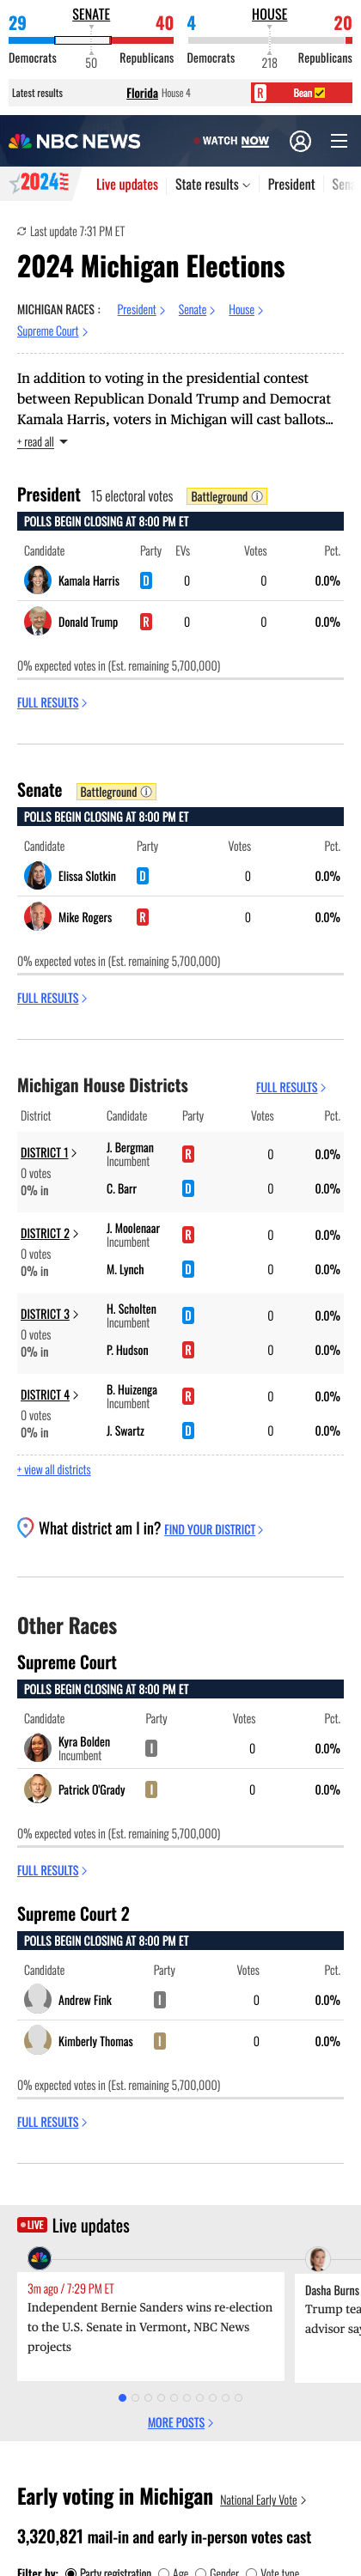
• Clear State Elections: Users can quickly see the major races (Senate, Governor, etc.) in their state.
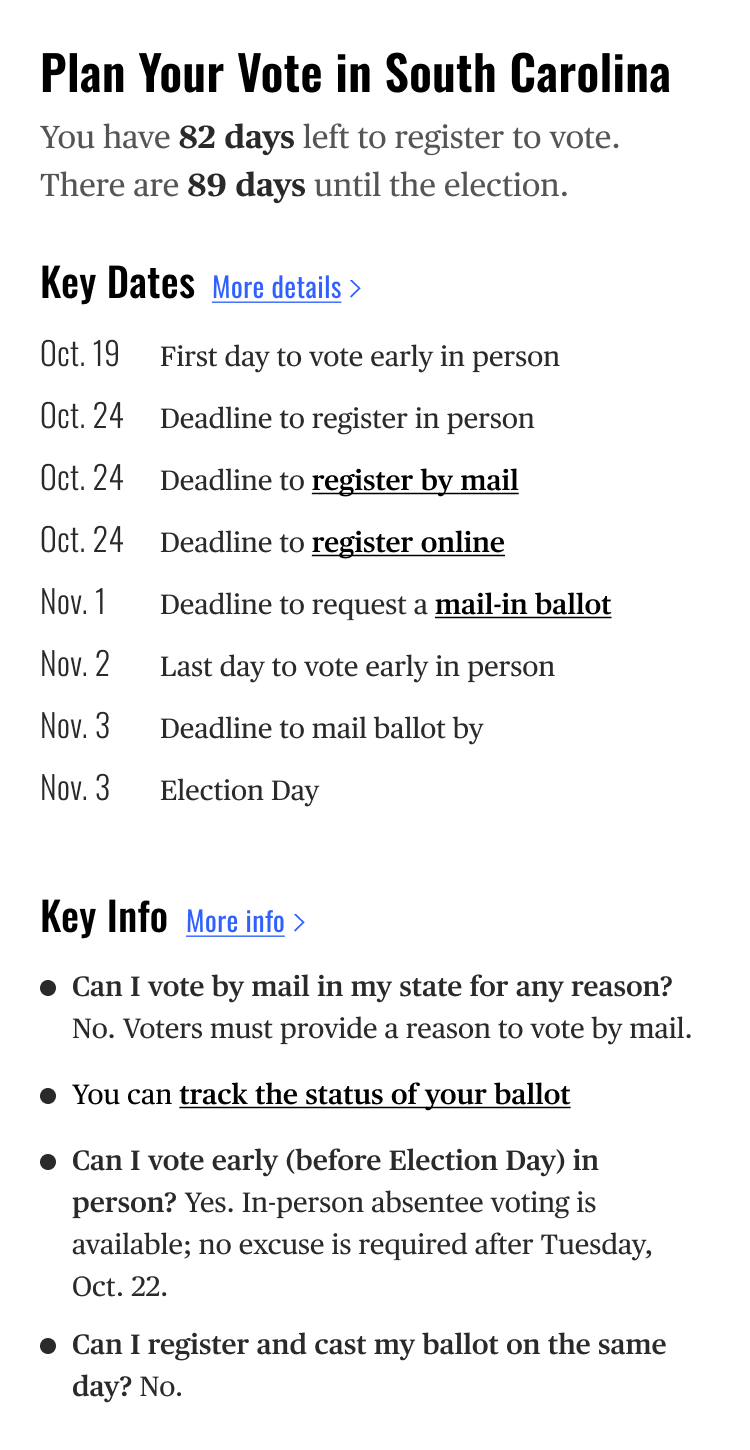
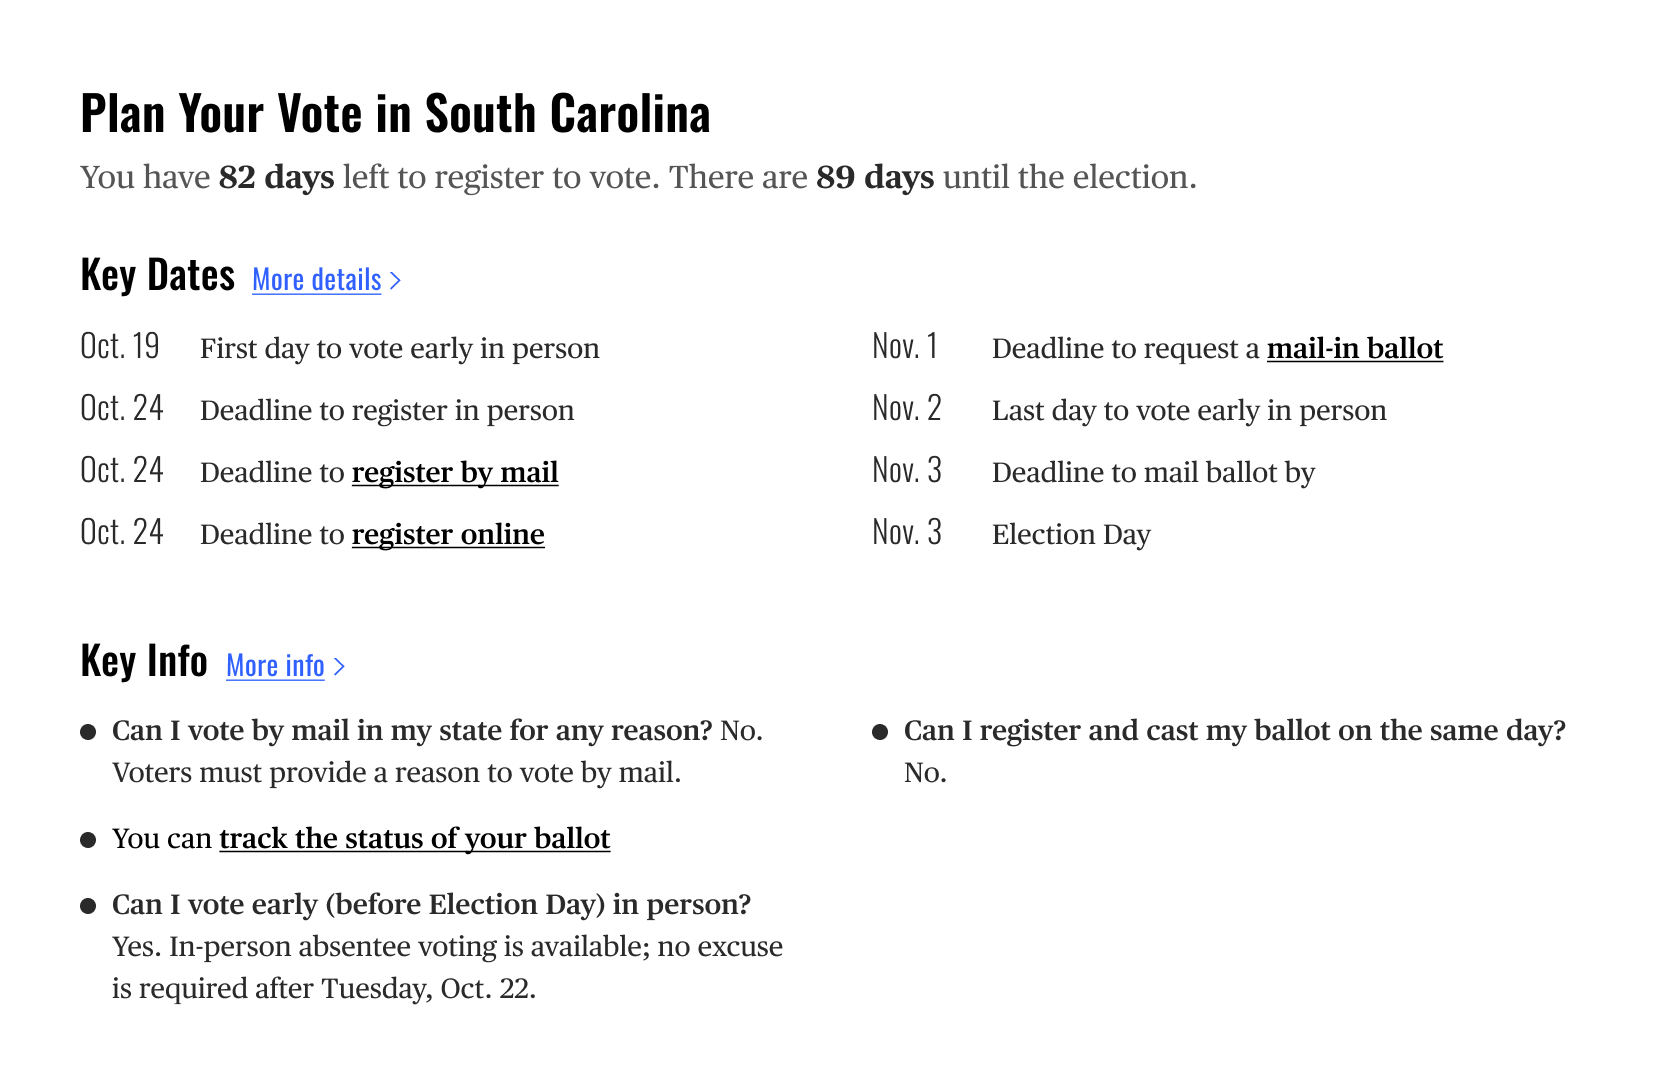
• Helpful 'Plan Your Vote' Tools: We offer all the info needed to vote successfully, like deadlines, methods, and state-specific rules.
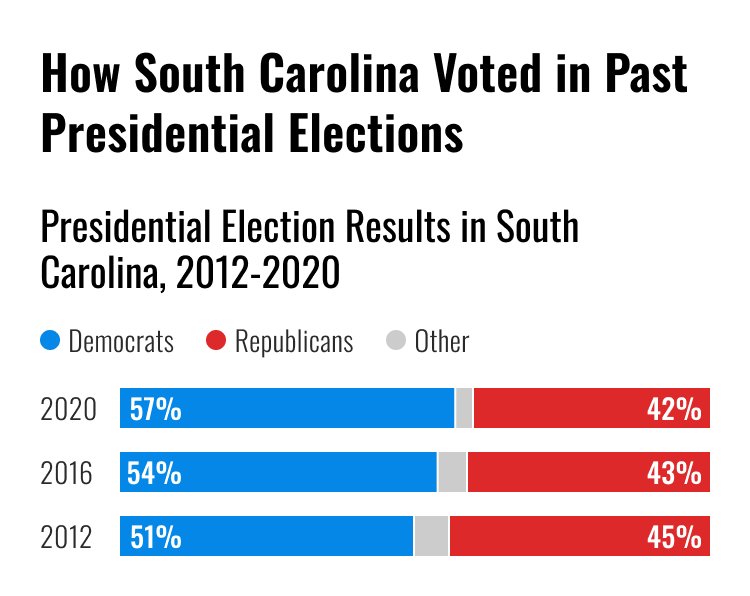
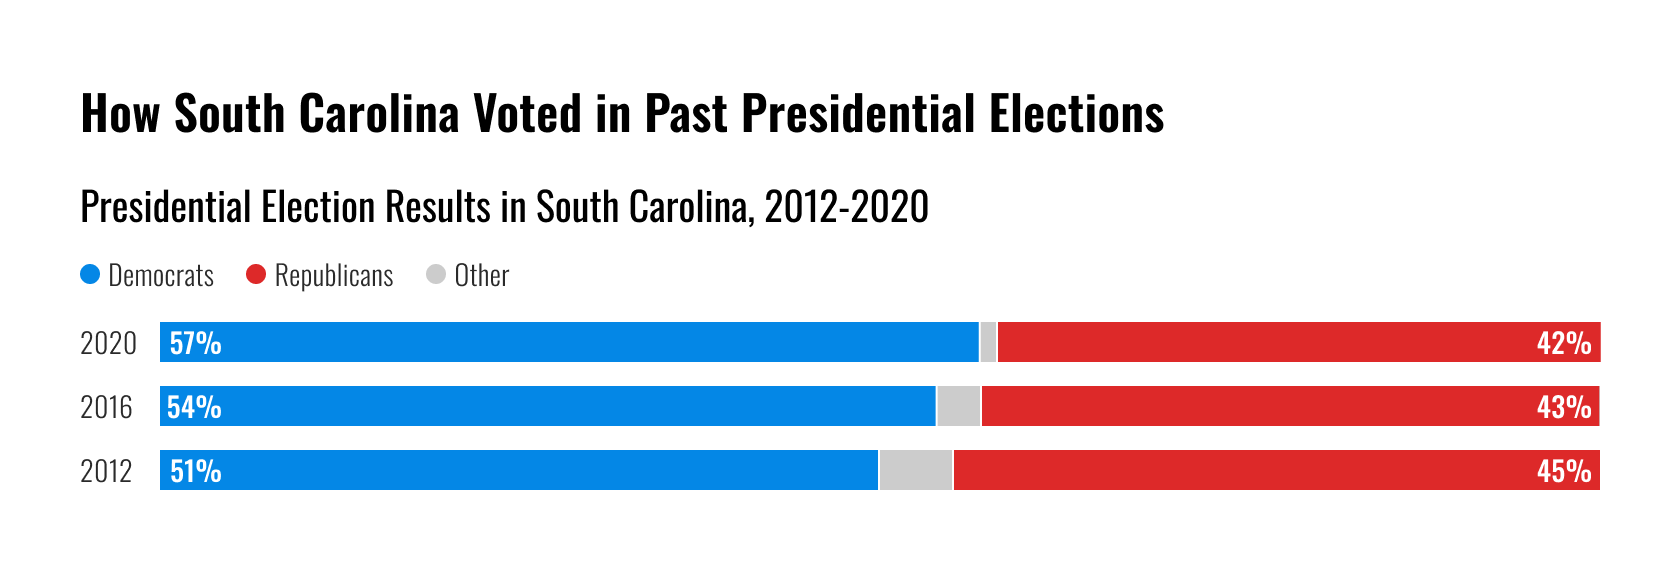
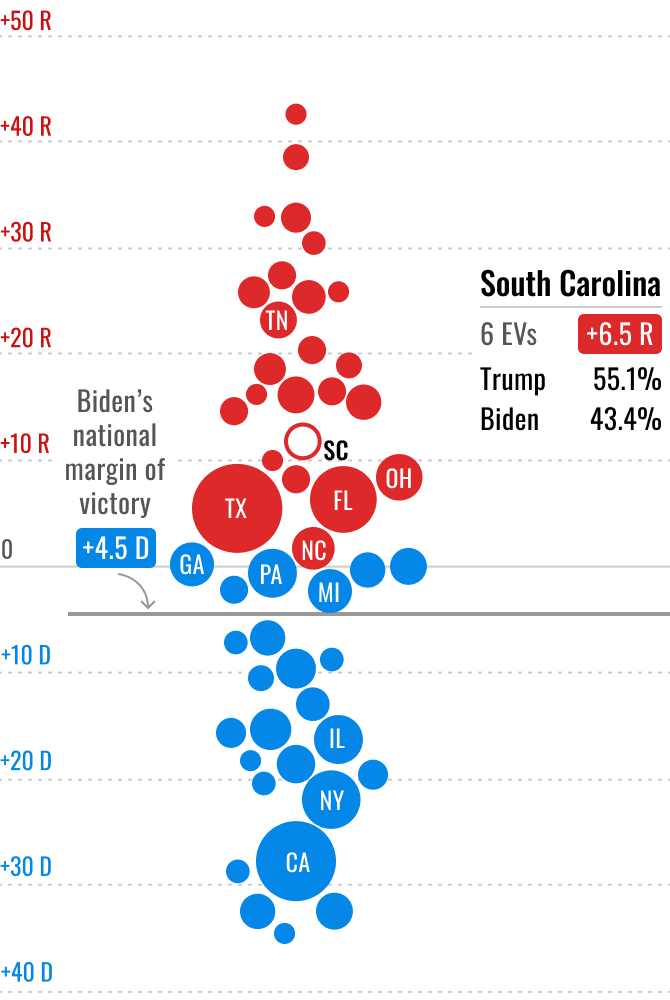
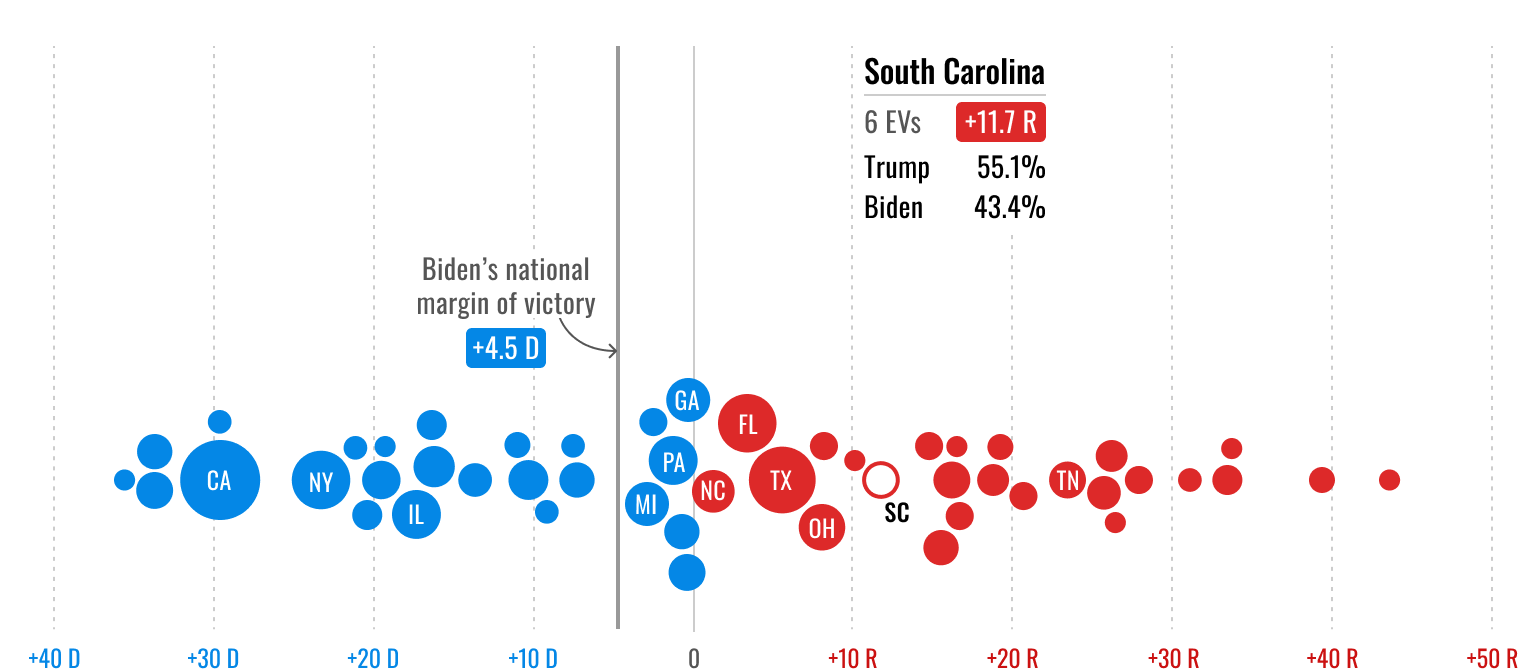
• Historical Data Integration: Users get context from past voting trends and demographic info for their state.
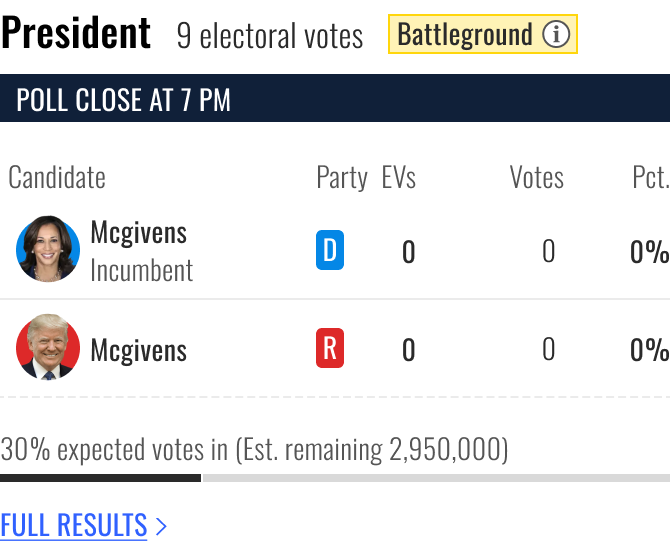
• Real-Time Election Updates: Stay updated with live results for all relevant state elections.
Turning user needs into State Page features:
Strategic content organization for enhanced discoverability:
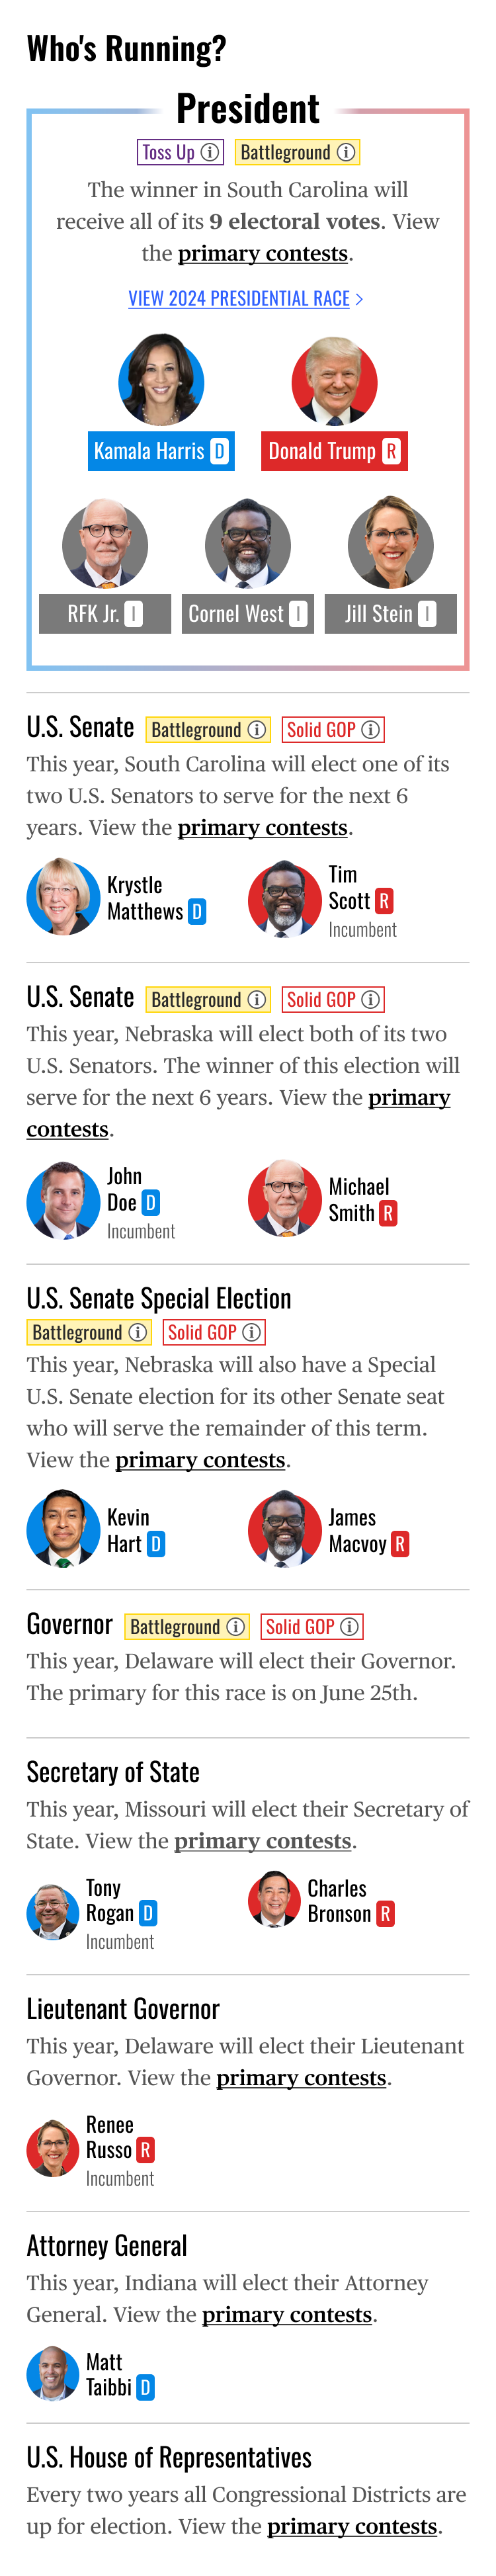
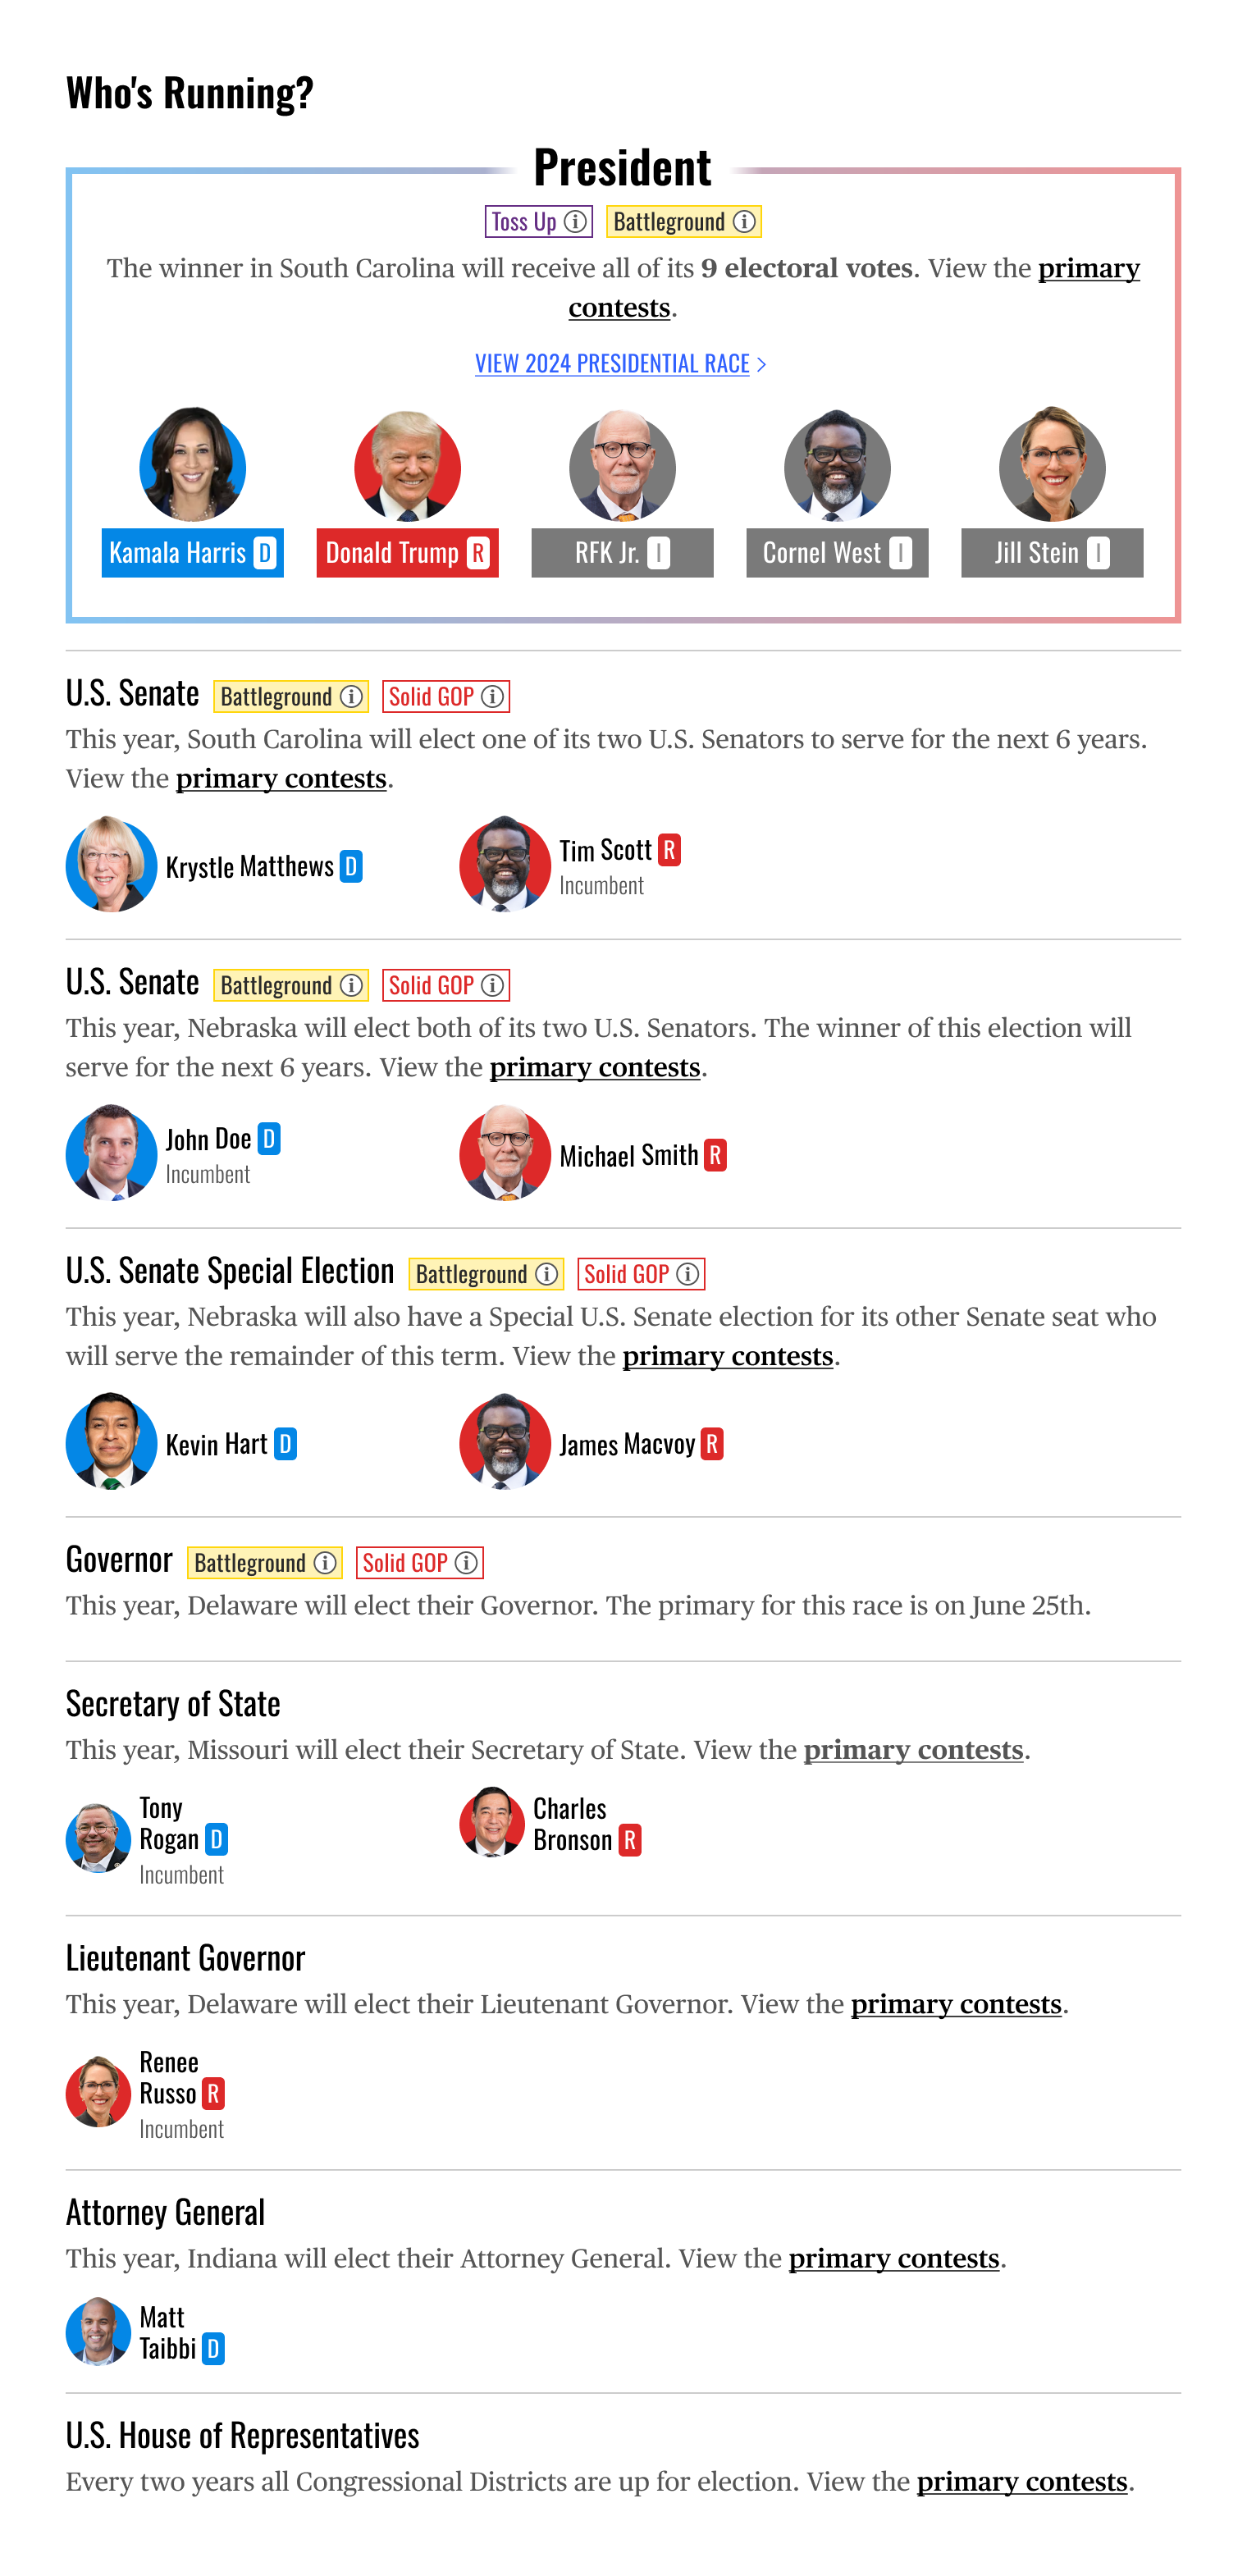
• Understanding State Races: 'Who's Running' section
• Facilitating Informed Voting: 'Plan Your Vote' section
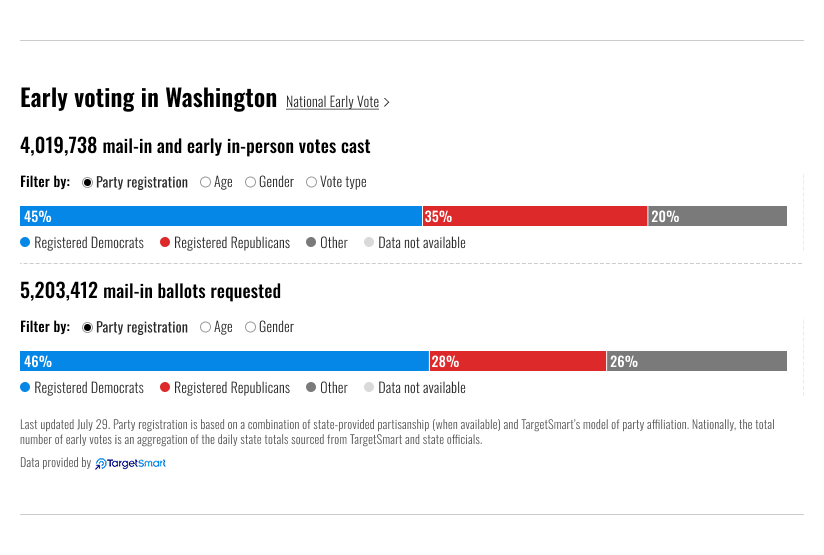
• Providing Historical Context: 'Historical Voting' section
• Delivering Real-Time Results: 'Race Results Tables with Maps'
‘Who’s Running’ section​​​​​​​
In the days leading up to the election, users want clear info about the candidates in their state. To cater to users with varying levels of knowledge, we included brief descriptions of each office and its election cycle.

On mobile

On desktop

'Plan Your Vote' section
To empower users to vote, this section offered key resources: registration dates, voting methods (mail, early, in person), and state-specific regulations.

On mobile

On desktop

'Current Office Holders' section
To offer additional context, this section clearly displayed the current officeholders for relevant positions within the user's state.

On mobile

On desktop

‘Historical Voting’ section
This section provided valuable historical perspective by showcasing the state's voting patterns in previous elections, highlighting its overall political leaning (red/blue), and presenting demographic breakdowns of past voting behavior.

On mobile

On desktop

Bee Swarm Chart
This section showed how red or blue a state is compared to all the other states as well as the national average. We determined how red/blue a state is by the margin of victory of the presidential election in 2020. 

On mobile

On desktop

Election results phase
For the Election results phase, the modules we included were: state-wide race results tables, congressional district tables, state maps, our live blog embed, ballot measure results tables, and historical bar charts. 
Race results in the state​​​​​​​
This section delivered up-to-the-minute, real-time voting data for all key races happening within the user's selected state.

On mobile; Presidential race; zero state

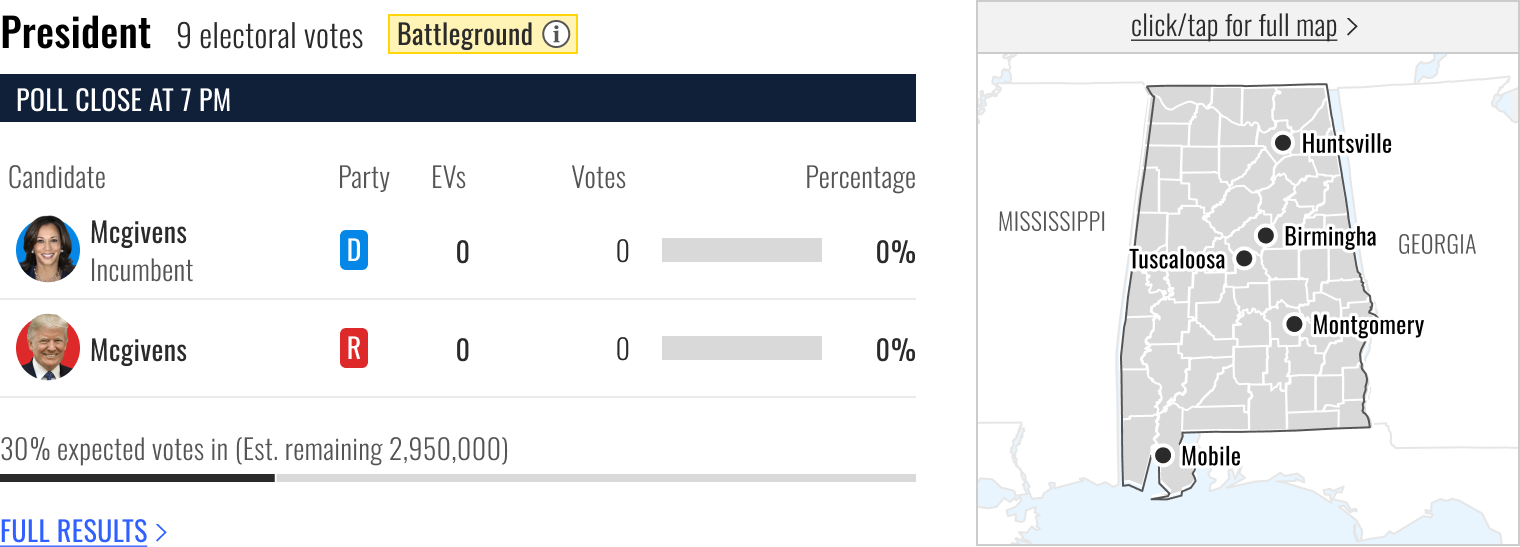
On desktop; Presidential race; zero state

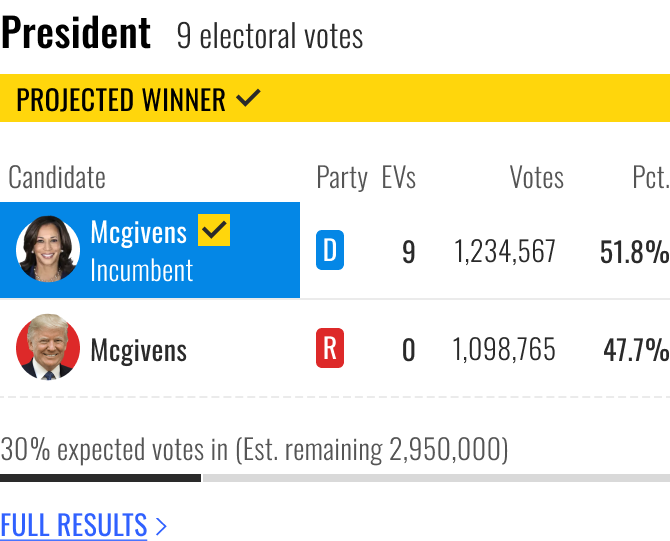
On mobile; Presidential race; winner called state

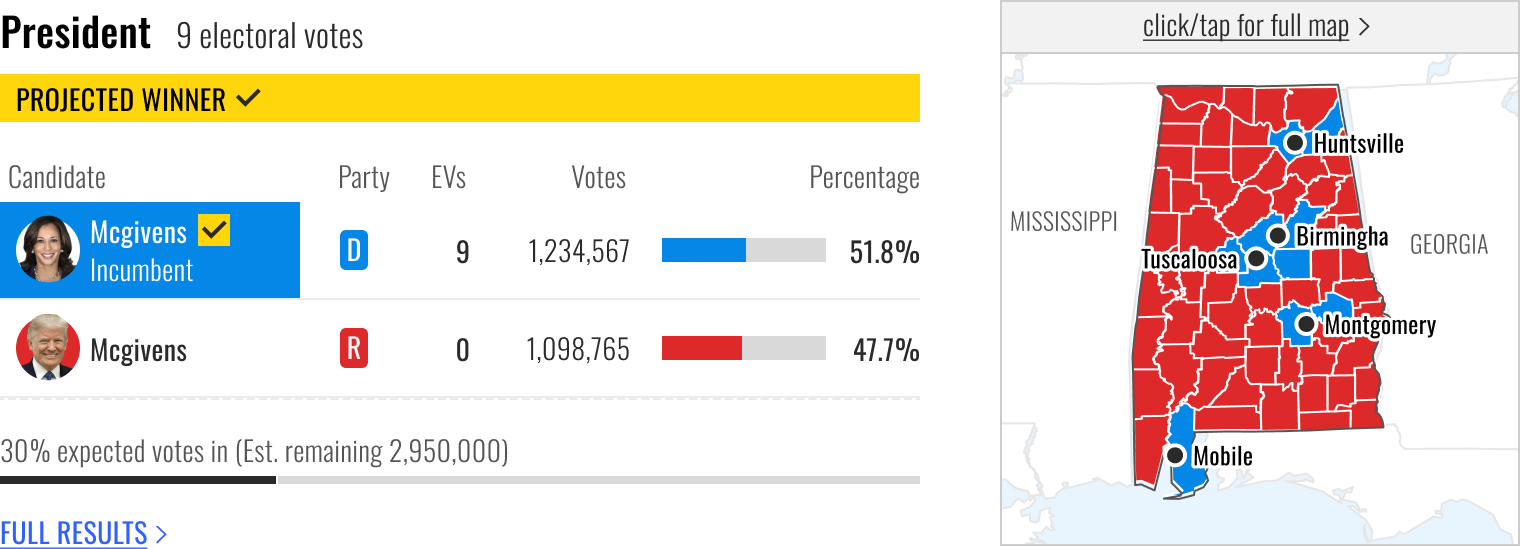
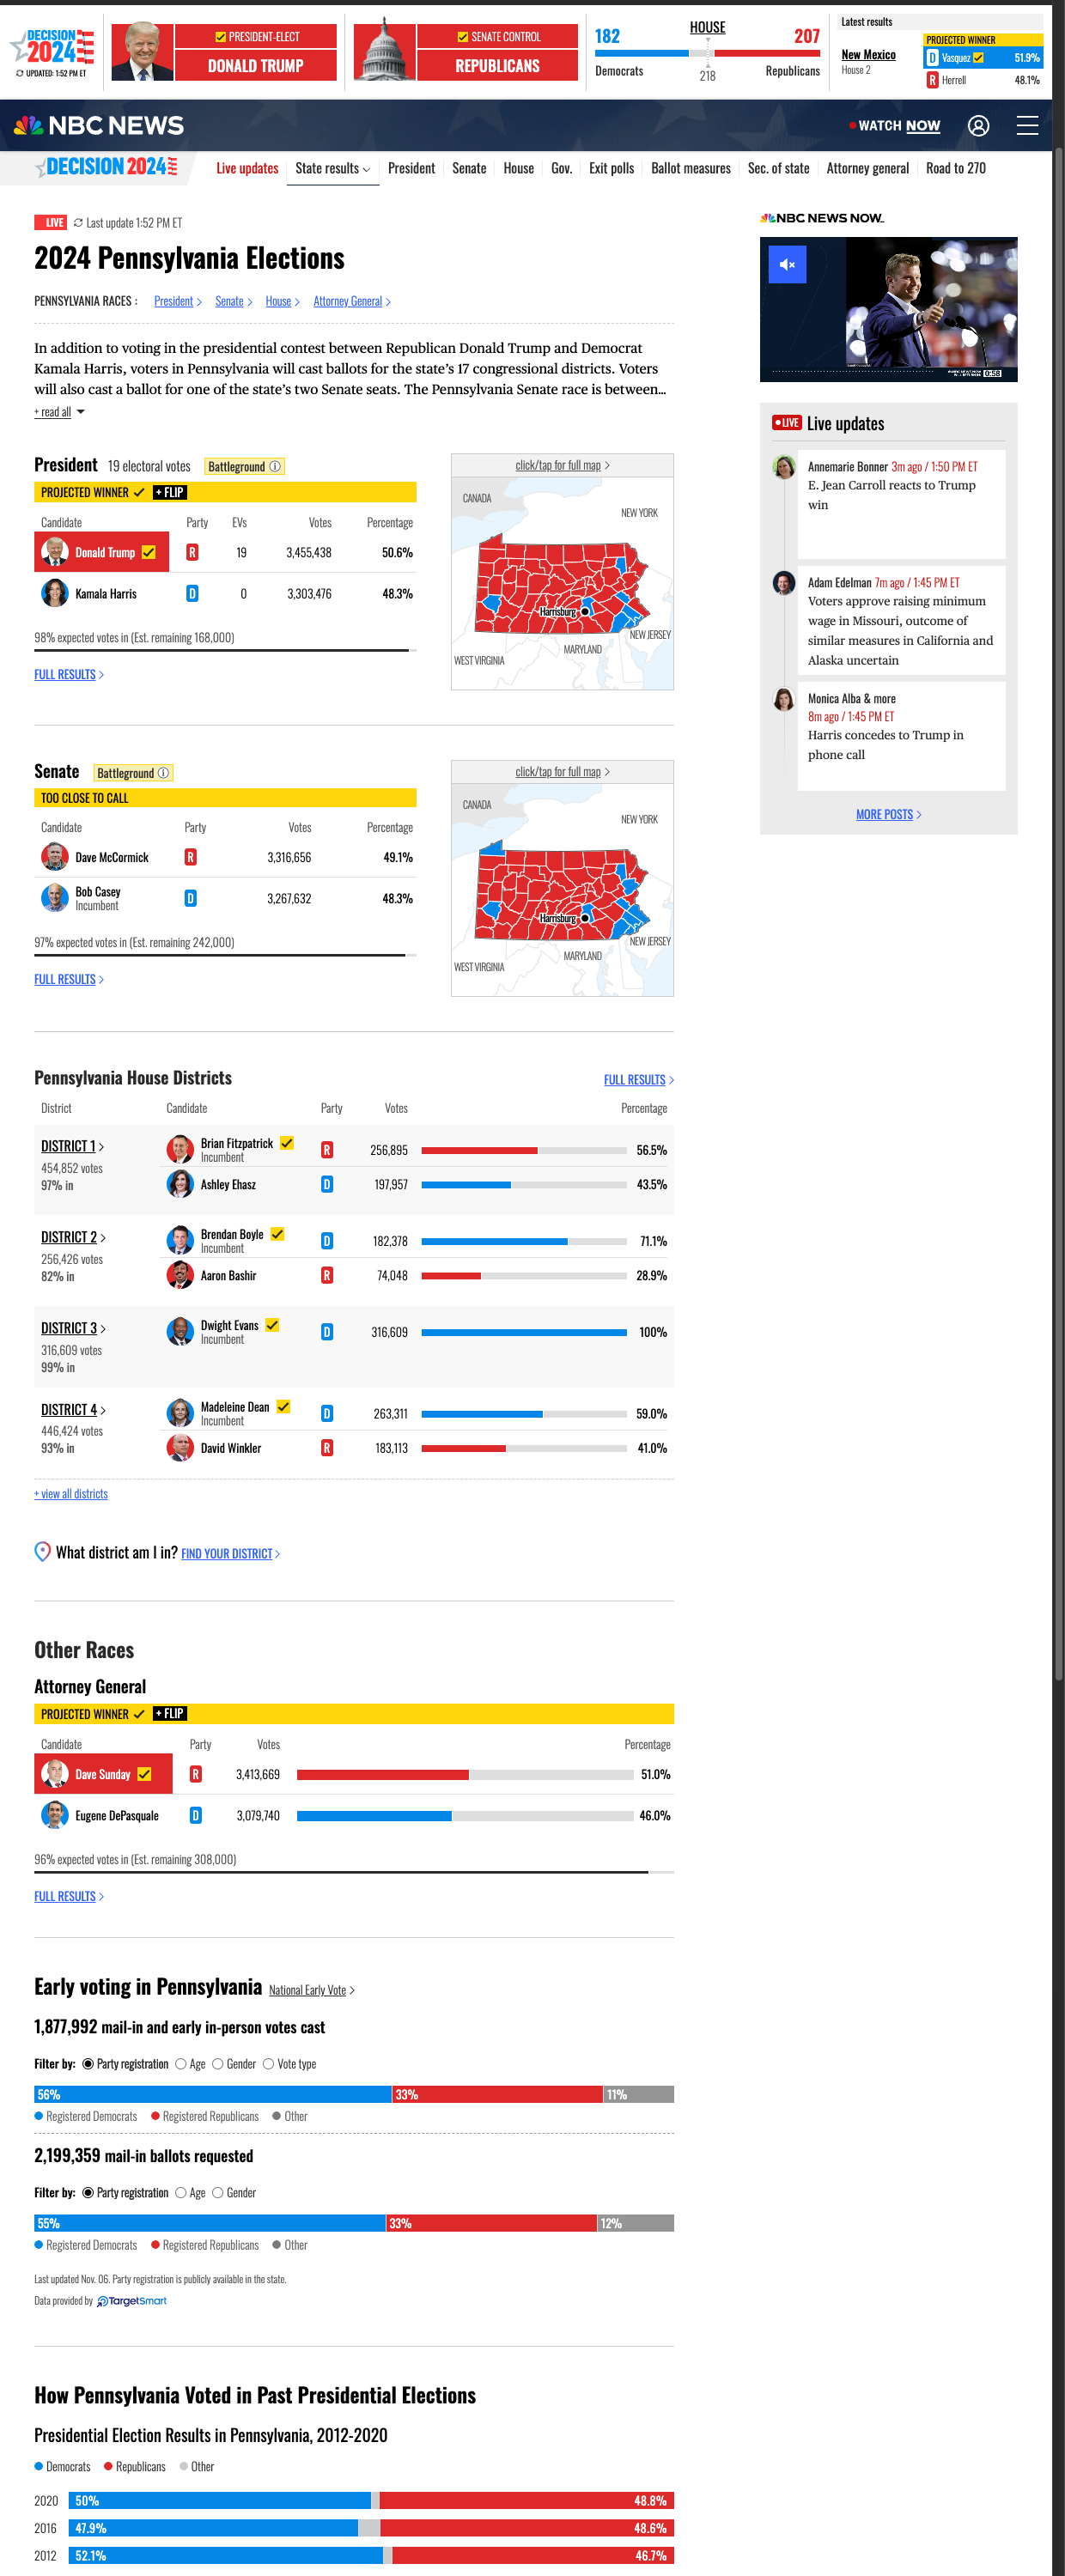
On desktop; Presidential race; winner called state

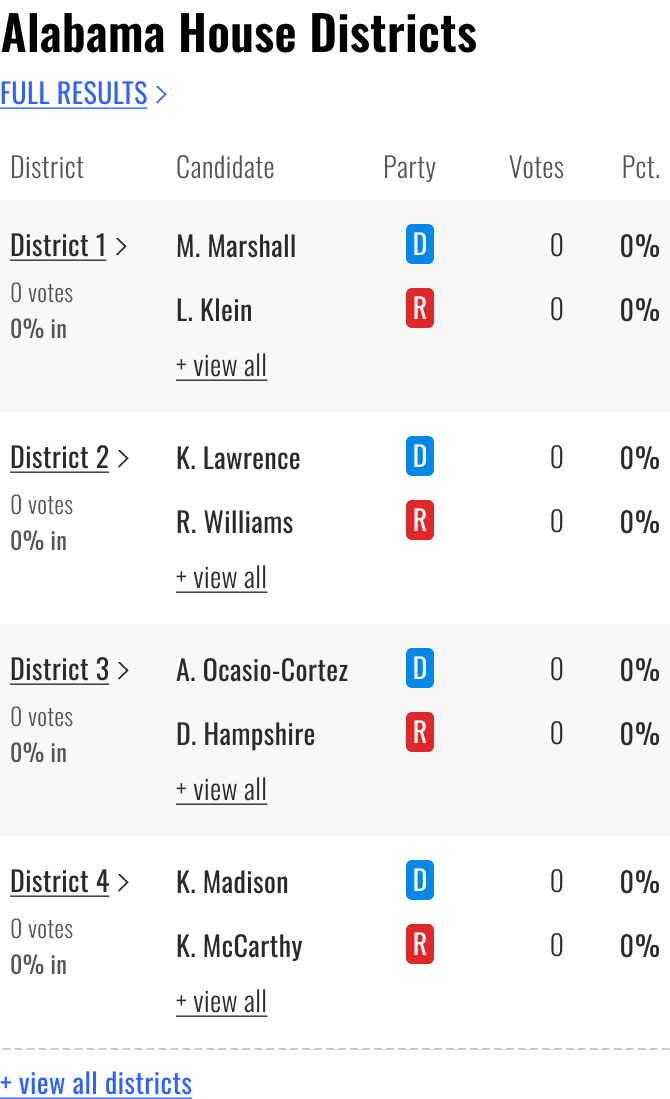
On mobile; House race; zero state

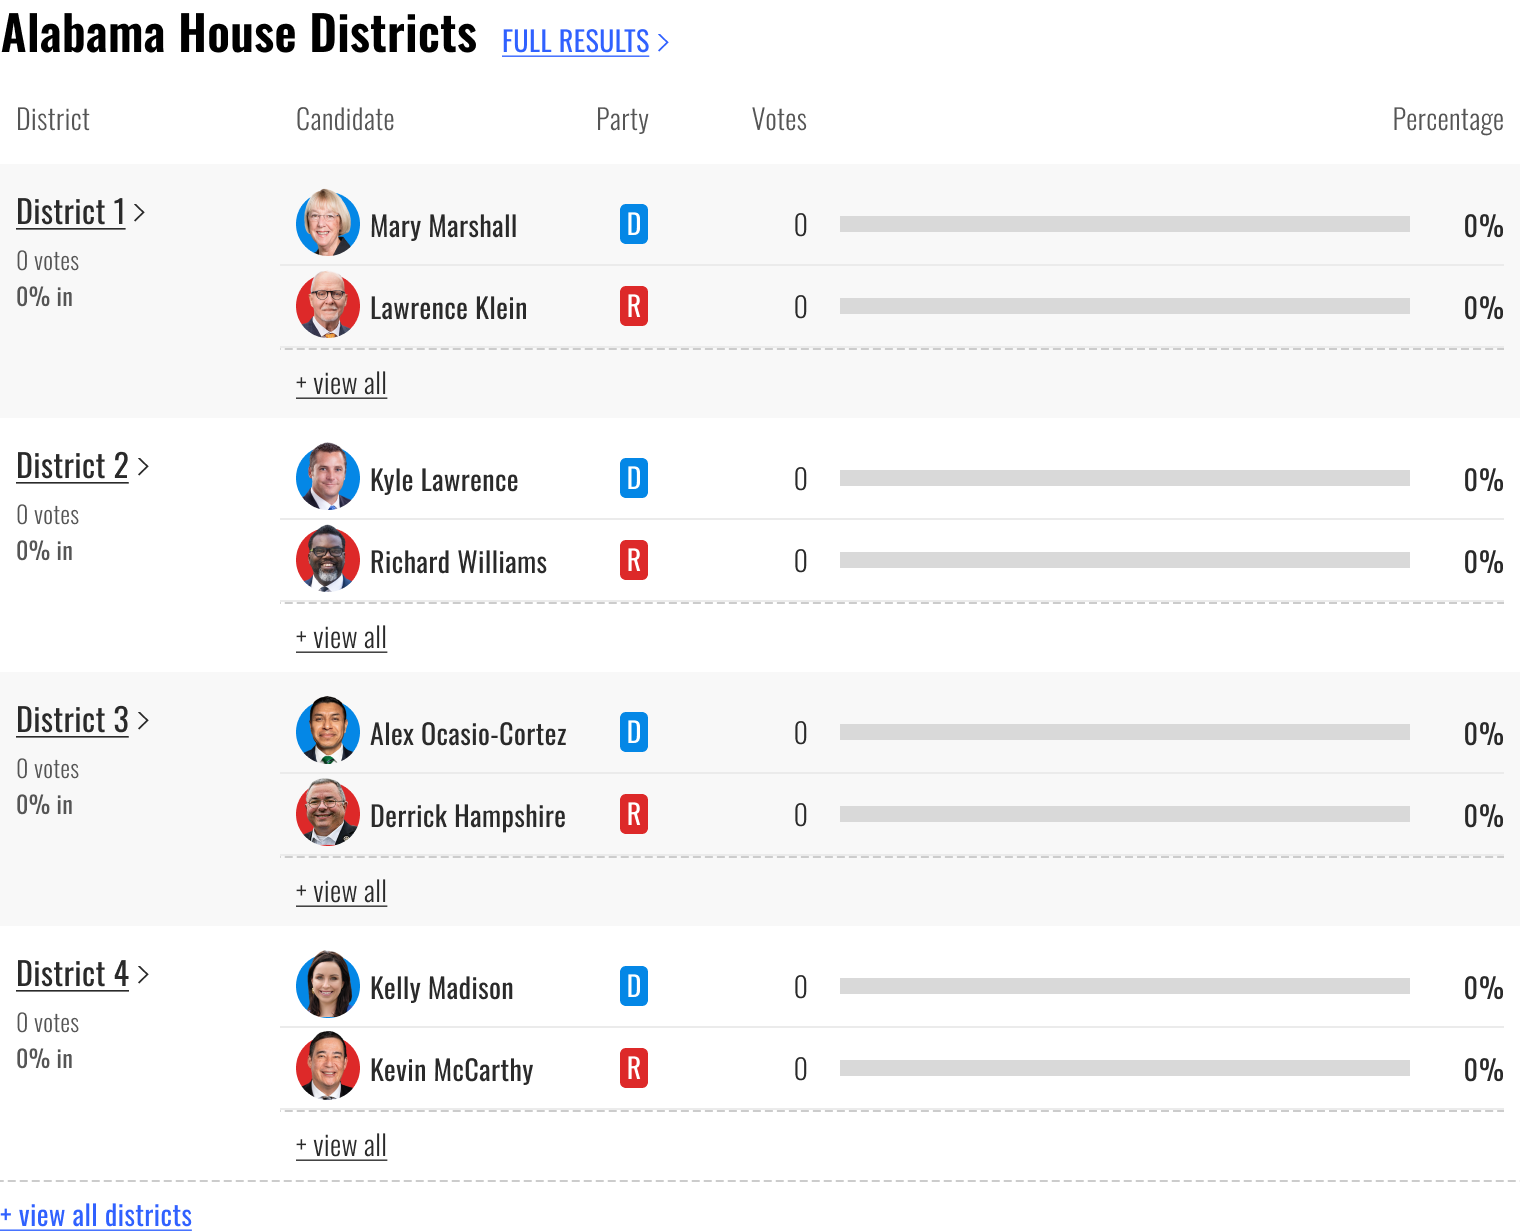
On desktop; House race; zero state

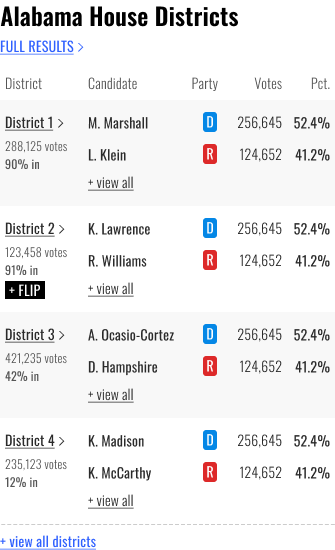
On mobile; House race; with data state

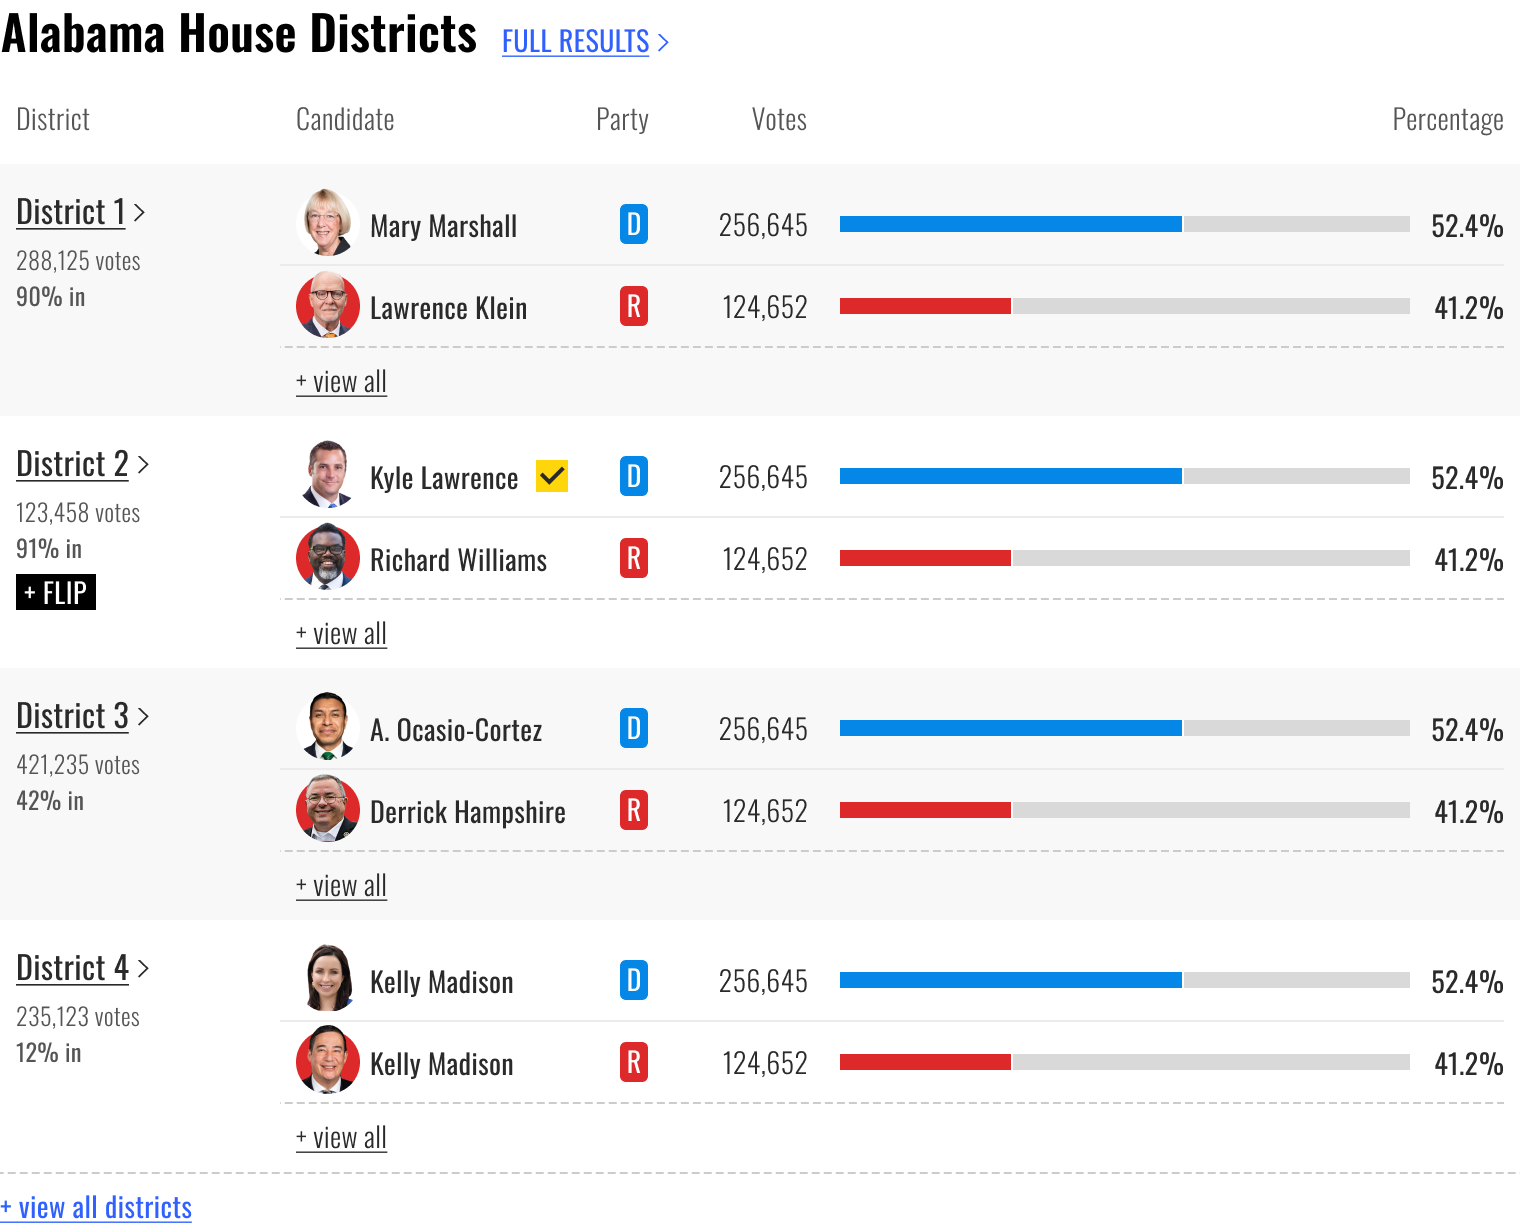
On desktop; House race; with data state

Early voting results in the state
This dedicated section presented specific data related to early voting within the state, offering a clearer picture of voter engagement prior to election day.

On mobile

On desktop

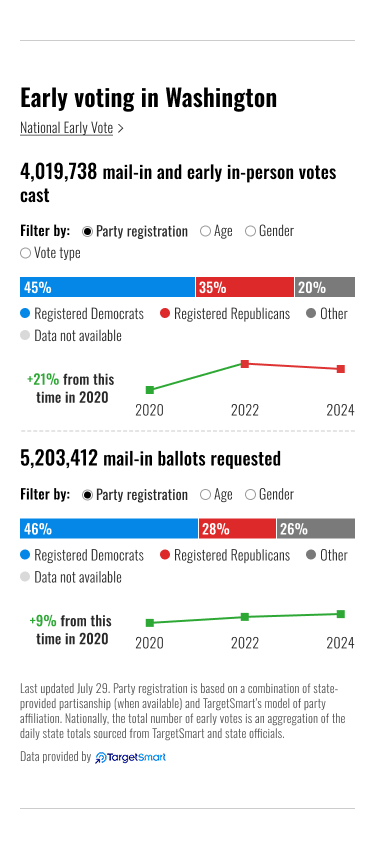
On mobile; with comparison graph

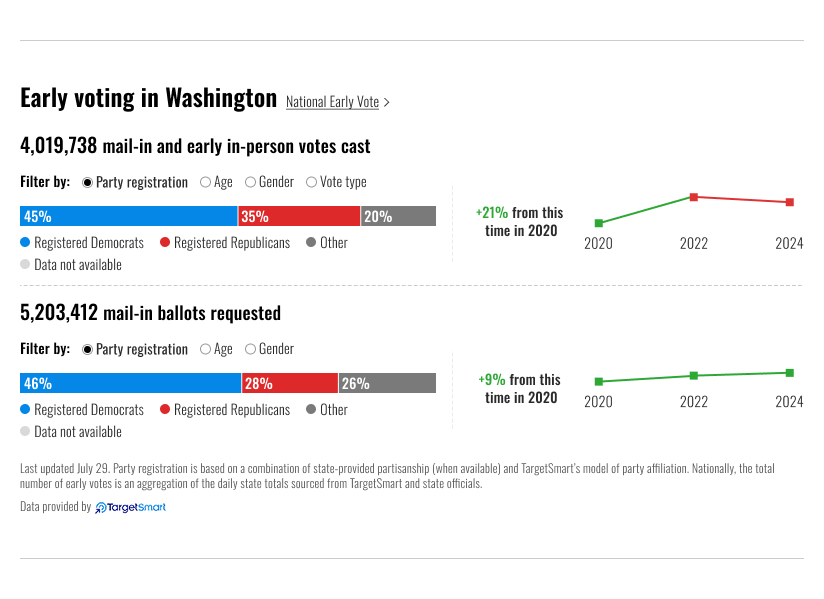
On desktop; with comparison graph

And here’s how they all looked on election night...​​​​​​​

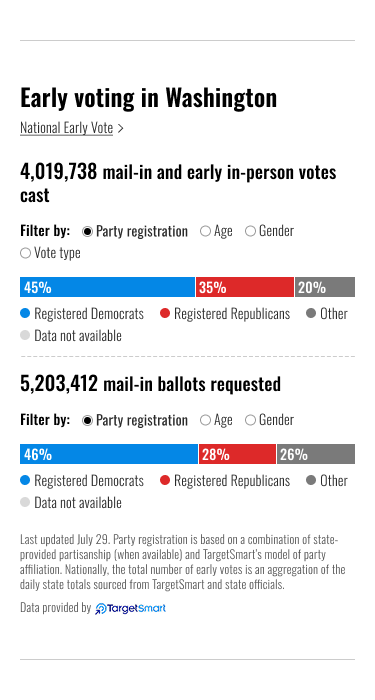
On mobile; zero state

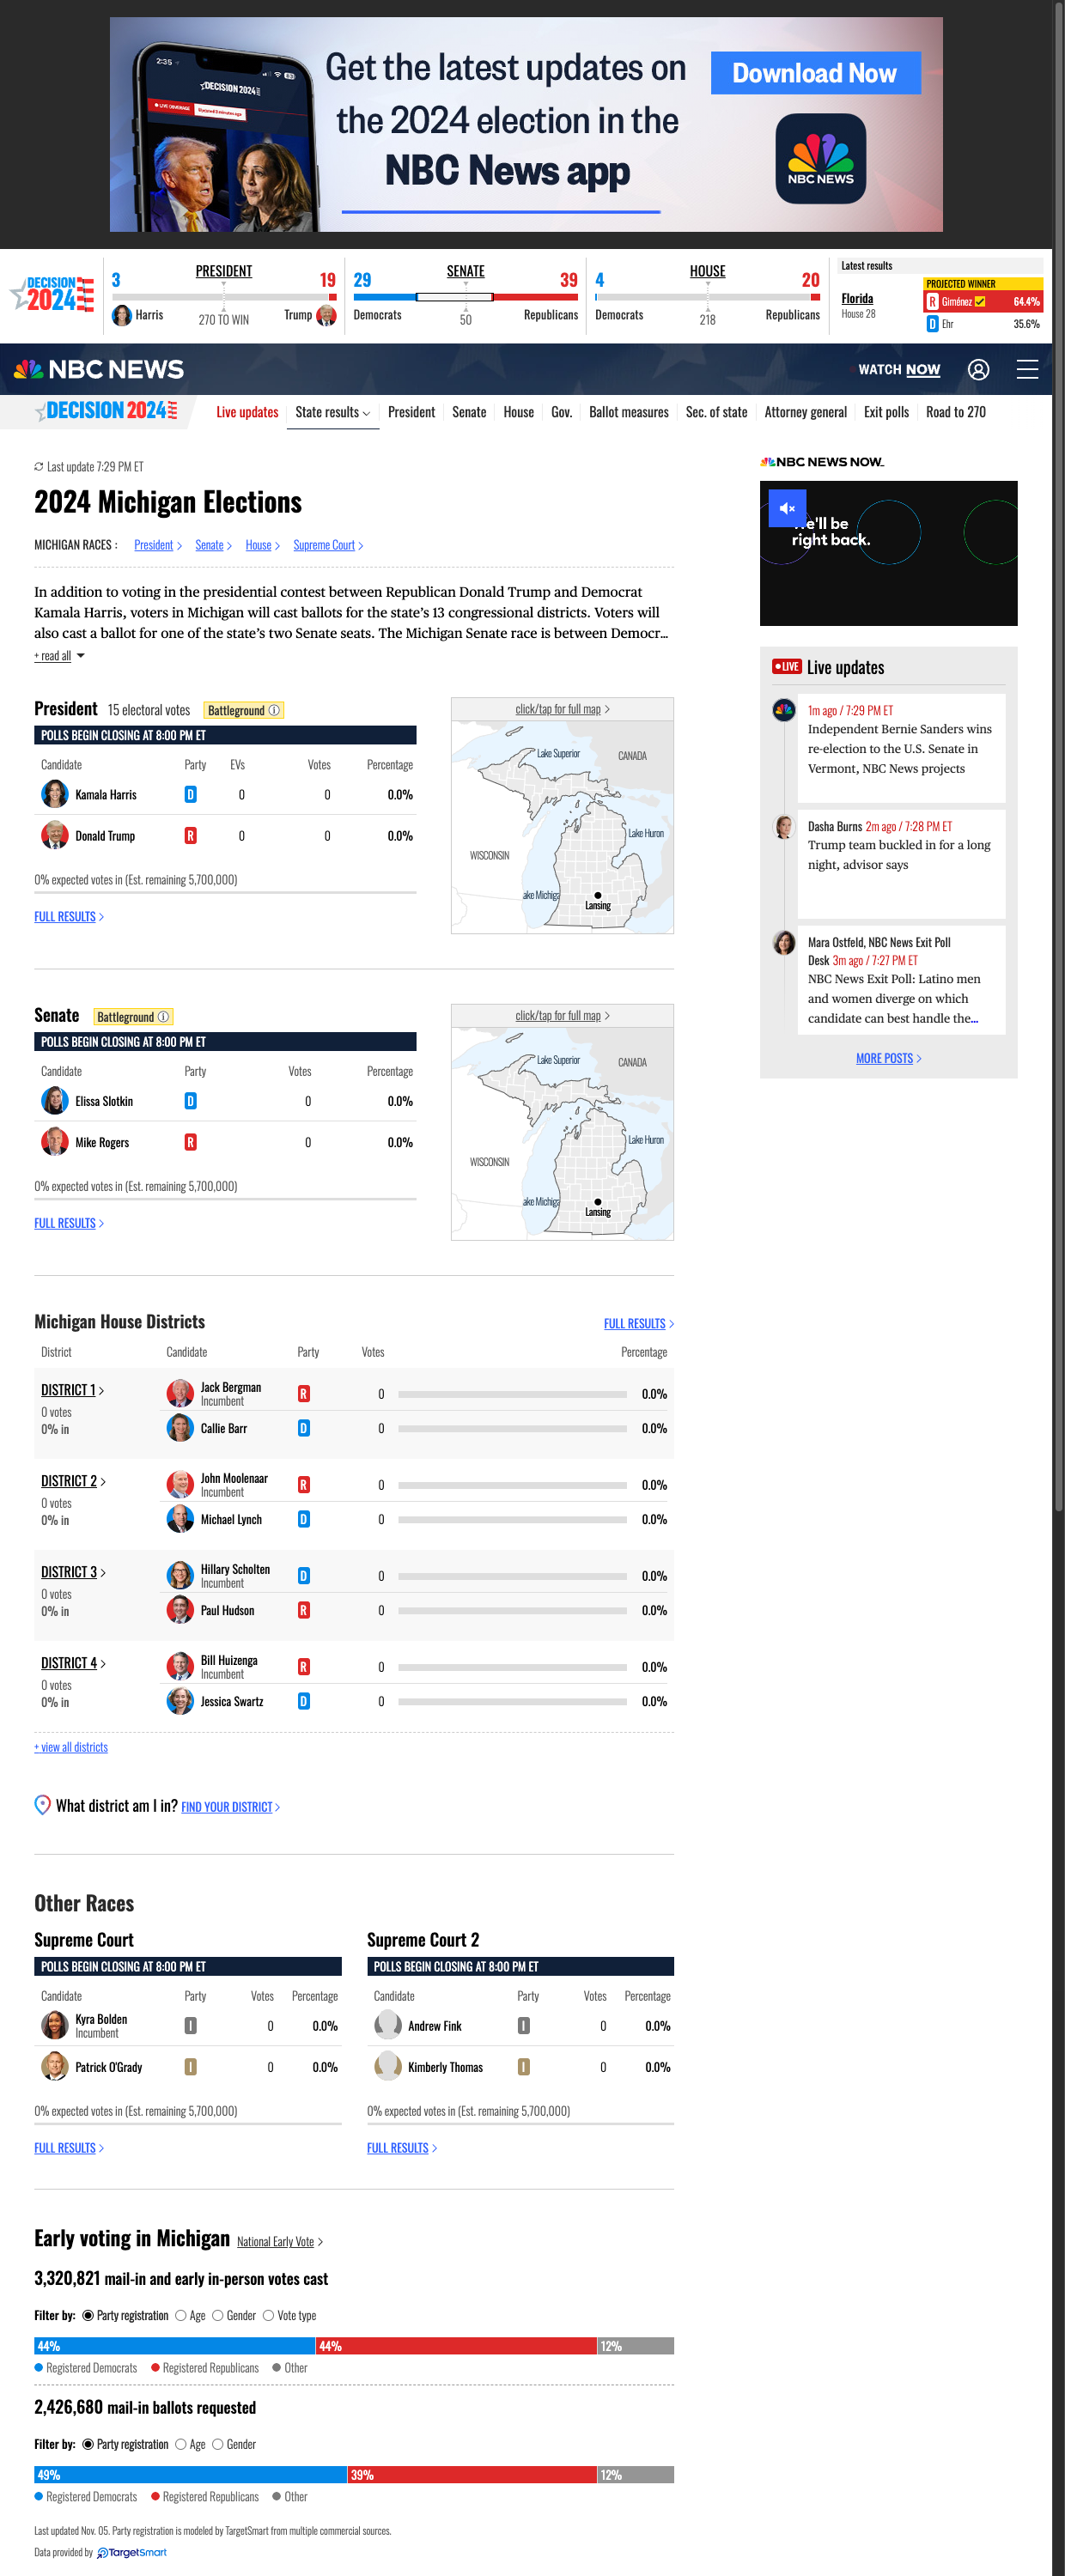
On desktop; zero state

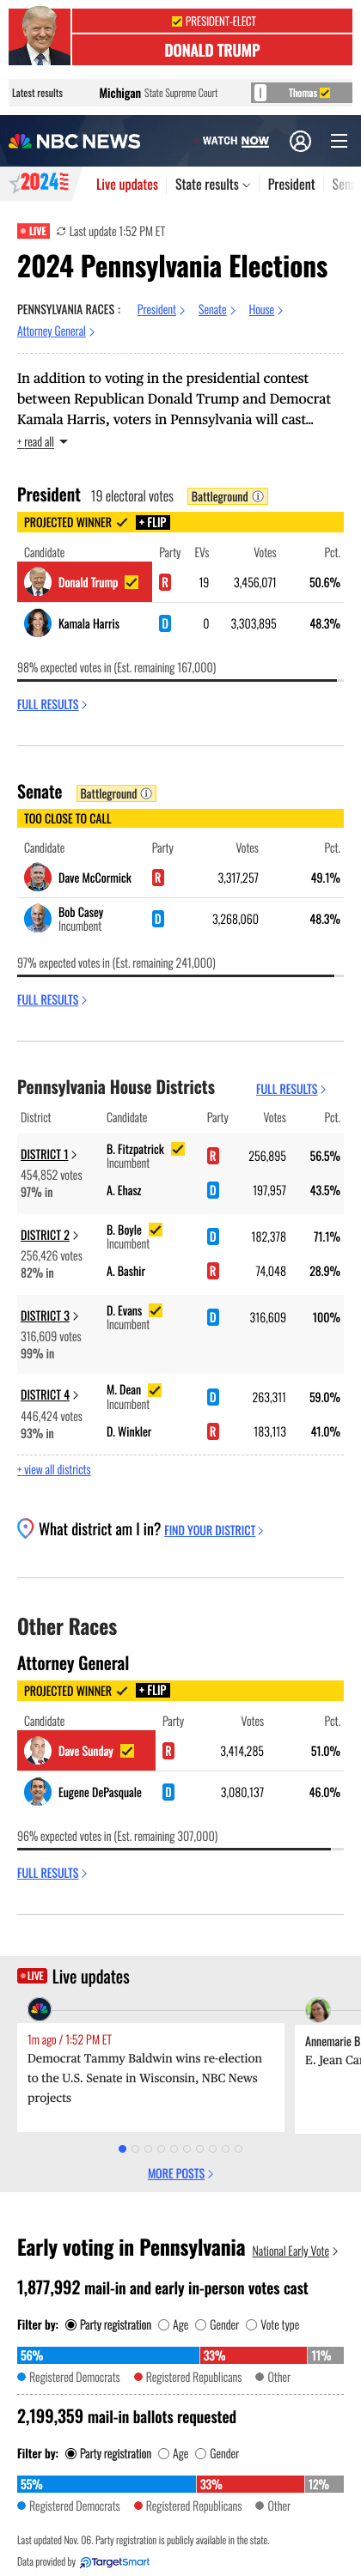
On mobile; with results

On desktop; with results

Elections Design System
​​​​​​​This project also included contributing to and pulling from a design system that was new and being constantly updated. Here's a sneak peak at our elections component library:

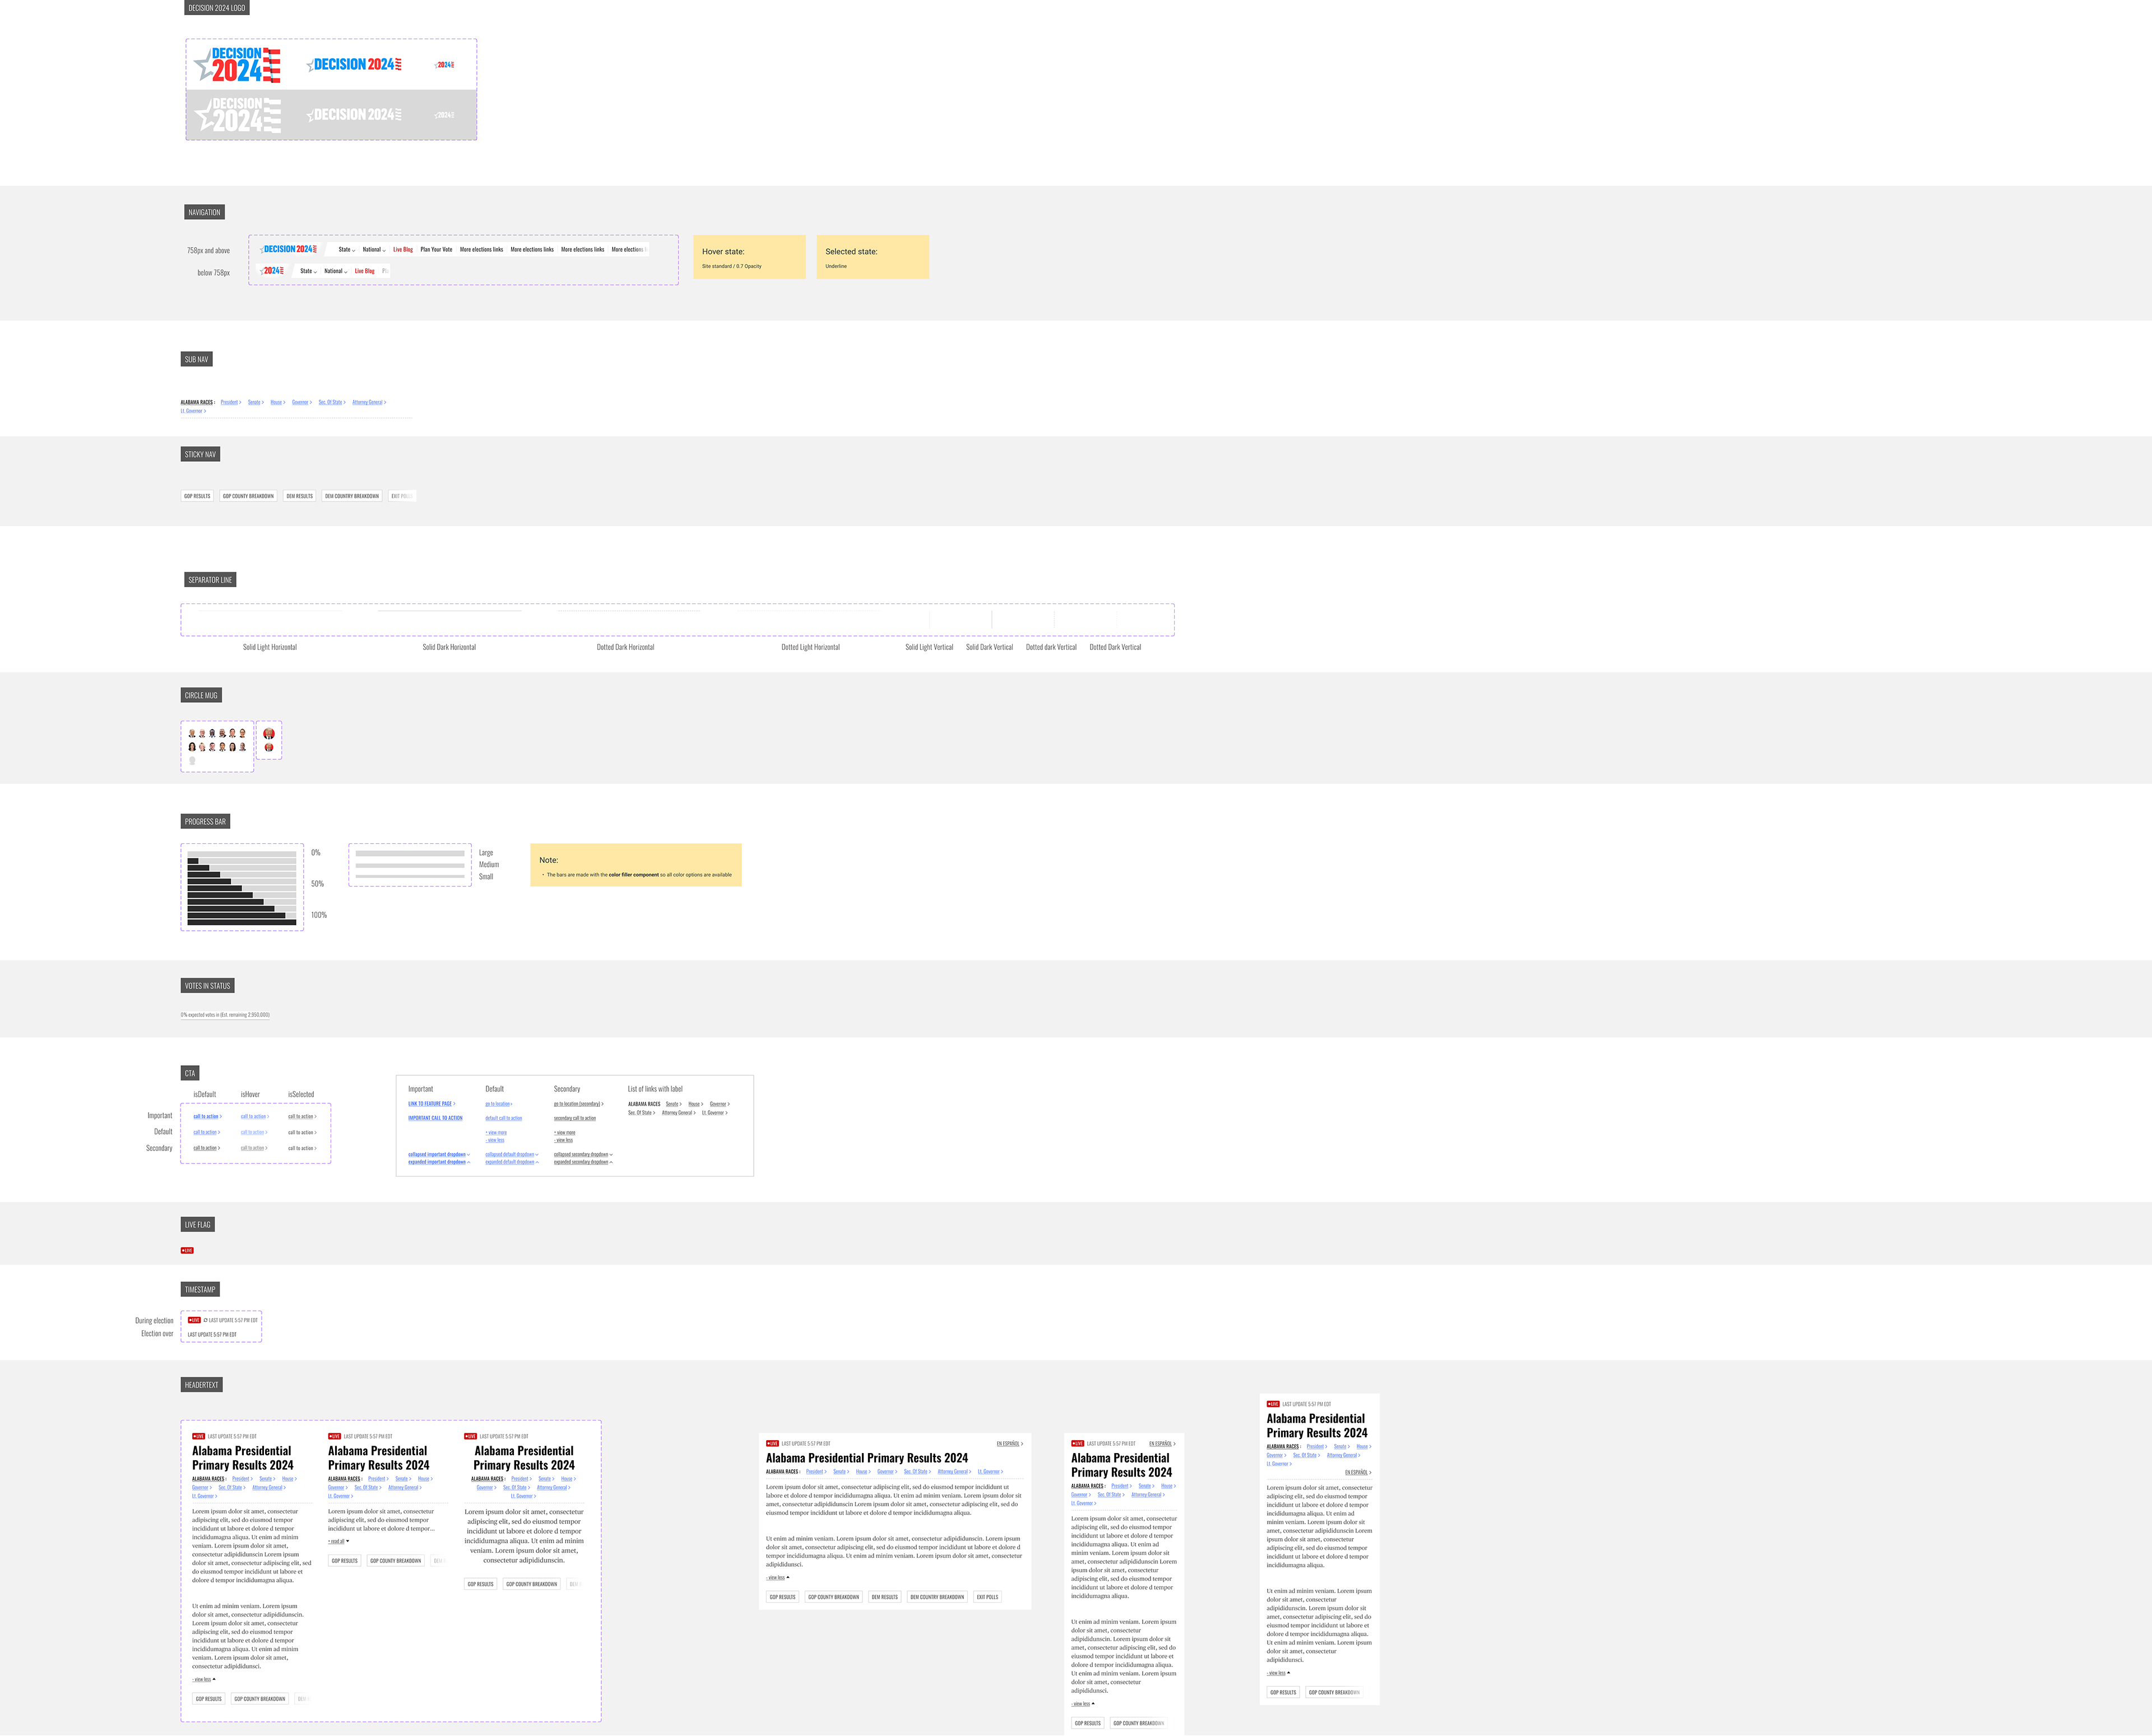
A small snapshot of some of the elections component library (1 of 2)

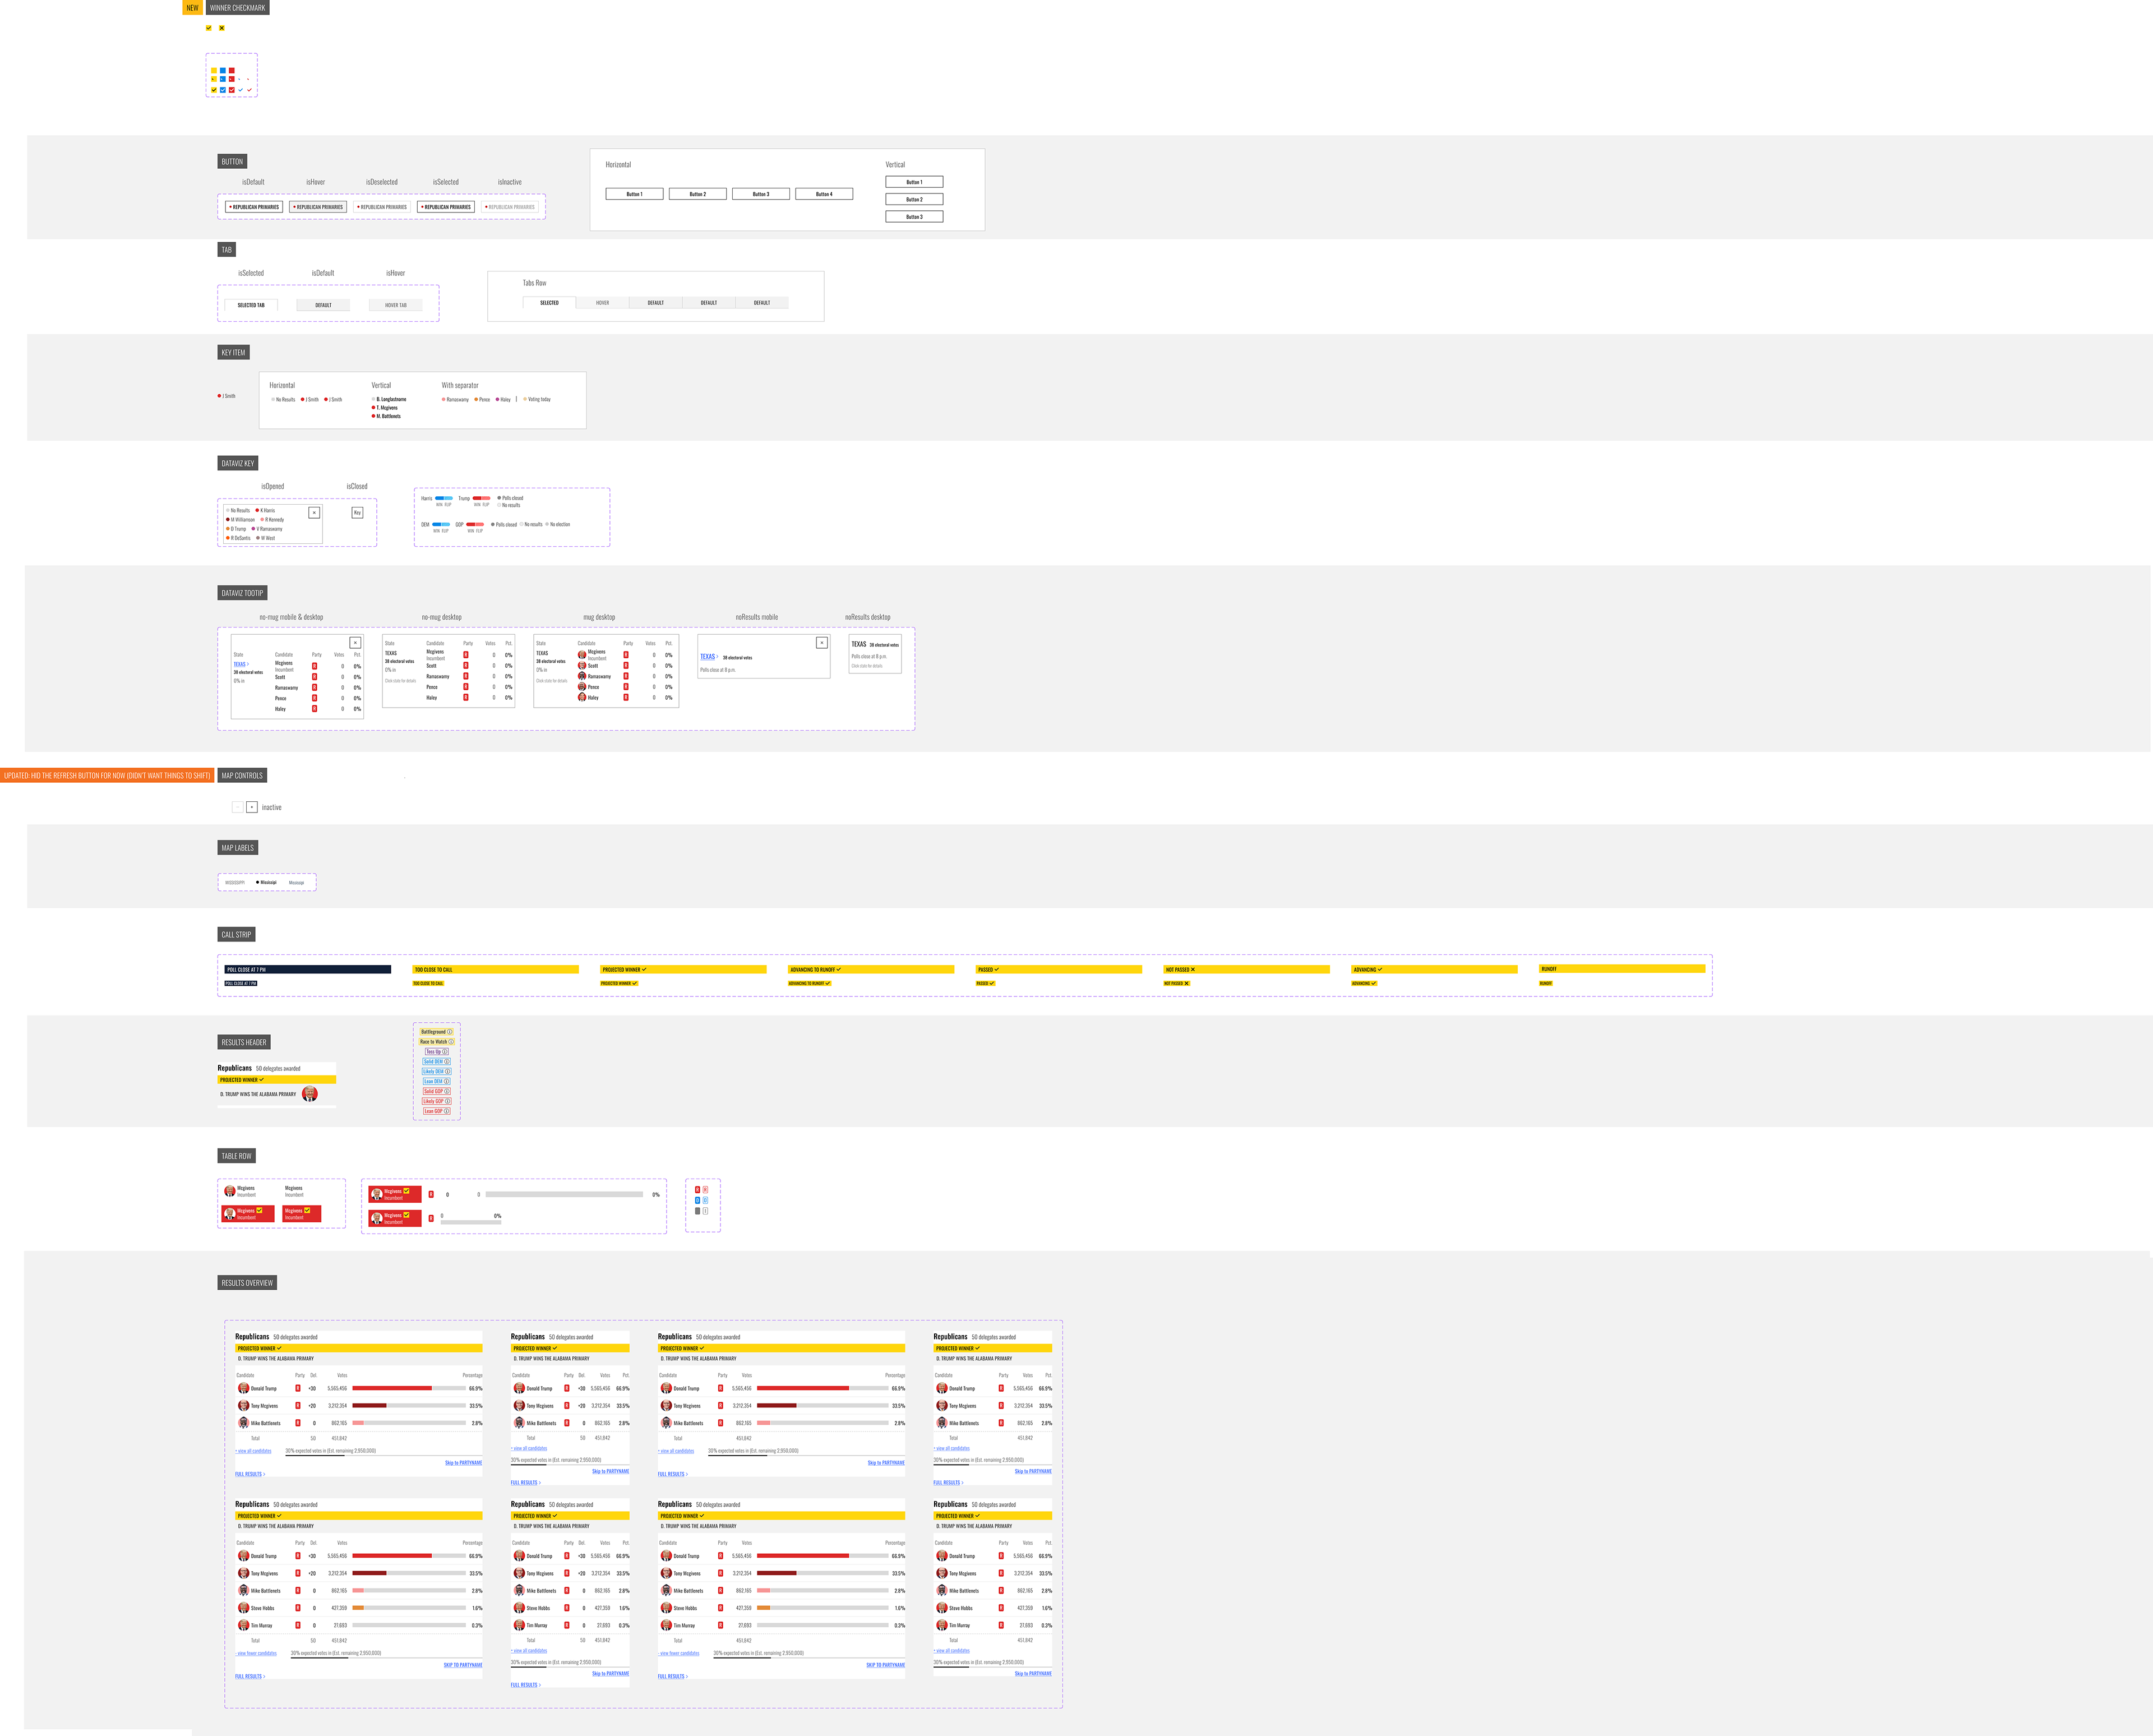
A small snapshot of some of the elections component library (2 of 2)

Outcome: Record-Breaking Engagement
According to Press Gazette, NBCNews.com ranked as the top website in traffic in over half of the United States during election night. Source: PressGazette
Our state pages achieved strong SEO performance due to their launch several weeks prior to election night.
Conclusion
NBC News' Editorial and Leadership expressed high satisfaction with the homepage design. Real-time results presentation effectively maximized user engagement and drove traffic throughout the site.

Some of the state results pages may still be live here: https://www.nbcnews.com/politics/2024-elections/arizona-results

Here is a slide deck of this case study